
Smart Water Metering Market by Type (Automated Meter Reading [AMR] and Advanced Metering Infrastructure [AMI]), Component (Endpoint Hardware, Network Infrastructure, and Installation), and Region (Americas, Europe, Asia Pacific, and Middle East & Africa) - Global Forecast to 2025
- June, 2019
- Domain: Electronics & Semiconductors - Electronics & Semiconductors
- Get Free 10% Customization in this Report
Smart Water Metering Market Overview:
The global smart water metering market is anticipated to witness significant growth during the forecast period. In recent years, the demand for water has increased significantly due to climate changes and other factors such as increasing population and rapid urbanization. As a result, governments across countries are heavily focusing on developing frameworks related to water management policies and a comprehensive strategy for long-term water resource management. This has pressurized water utilities to reduce water losses from both an environmental and financial standpoint.
Currently, the technology development and adoption of advanced technologies, such as IoT and analytics, in the water sector is lagging when compared to other utilities such as electricity and gas. Moreover, water systems in many countries are running on aged infrastructure, and technologies that utilities rely on managing water are largely outdated, which has resulted in increased non-revenue water (NRW).

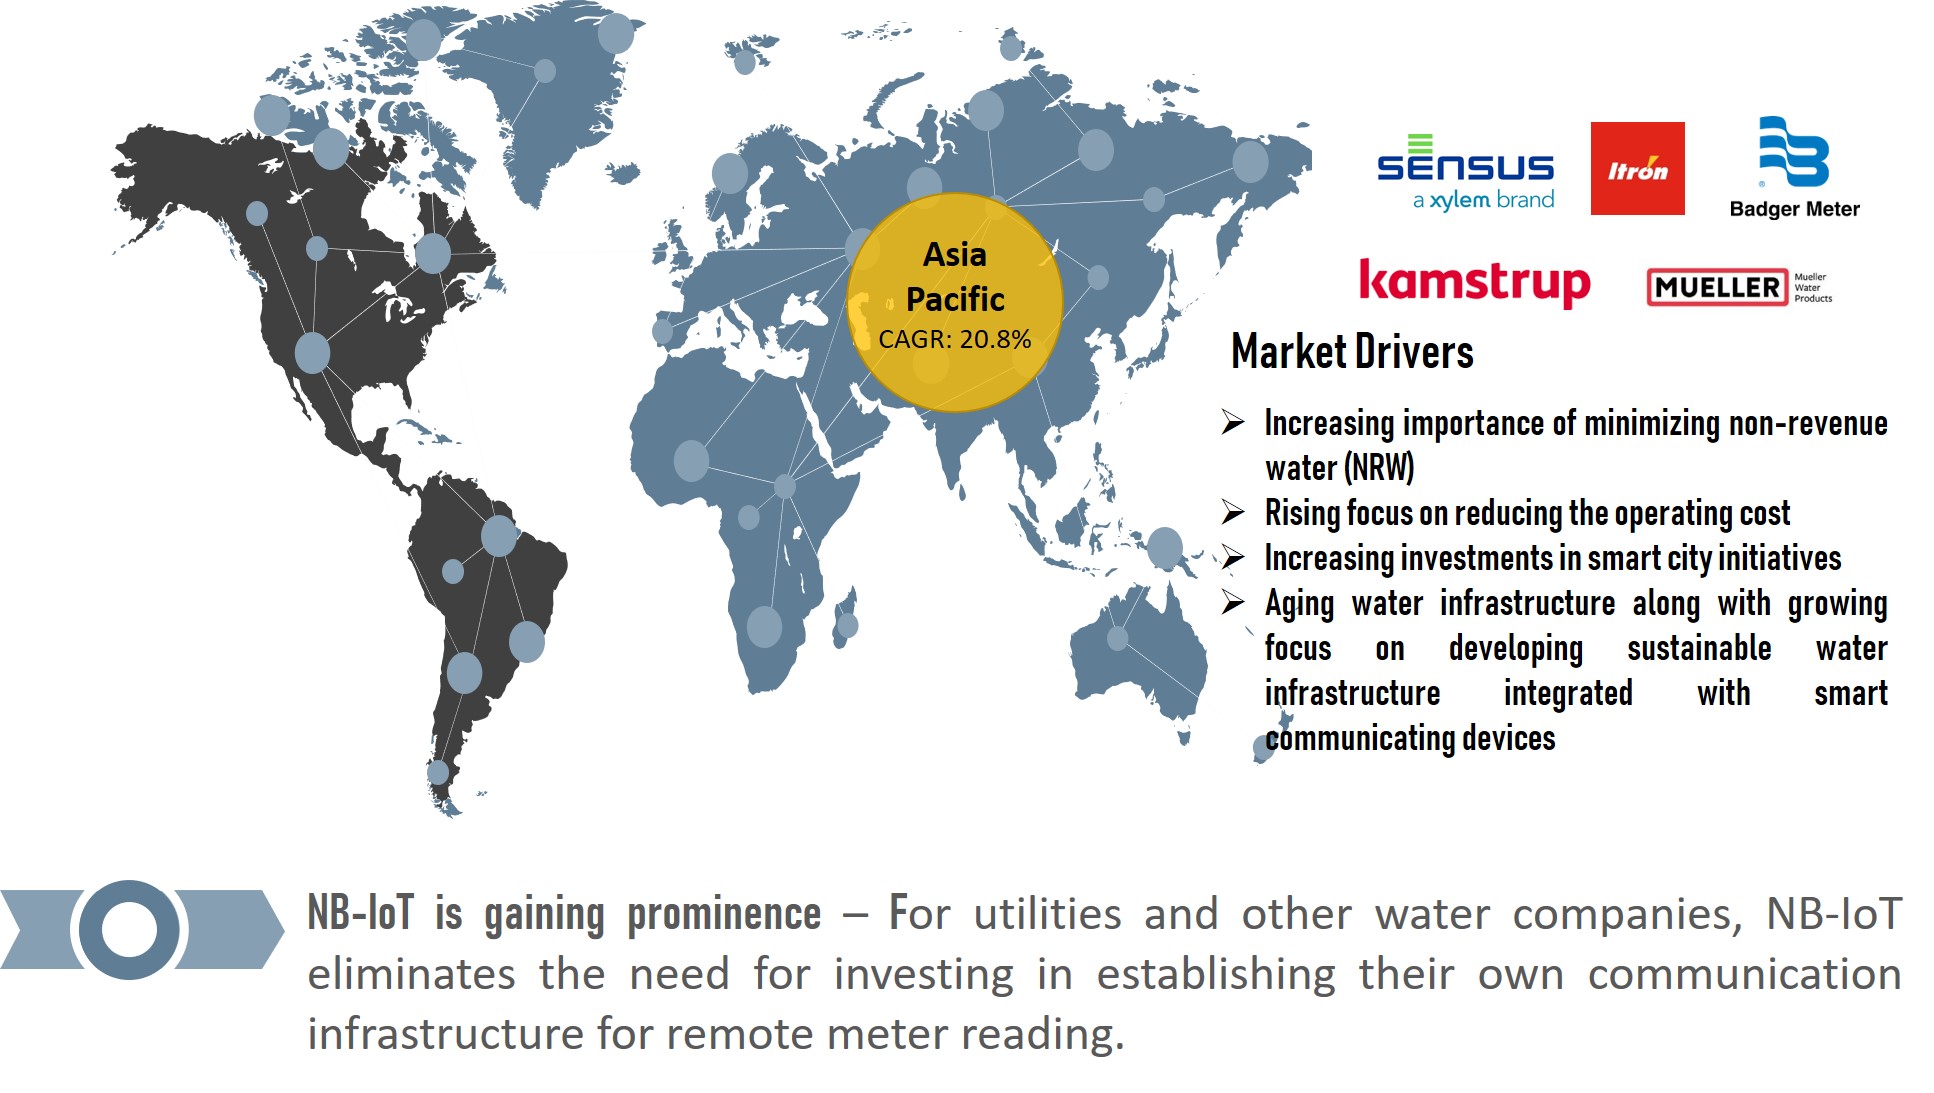
Governments and utilities are emphasizing on reducing non-revenue water, and transformation of aging water infrastructure with growing focus on developing sustainable water infrastructure. The market will witness demand for water metering solutions that can be integrated with smart communicating devices, as rising focus on reducing the operating cost driving the global smart water metering market. Emerging low power IoT connectivity technologies (NB-IoT) allow utilities to eliminate the need for investing in establishing their own communication infrastructure for remote meter reading, a prominent trend likely to accelerate the growth of the global smart water metering market during the forecast period. Additionally, increasing smart city initiatives and expanding urban landscape in developing economies are identified as opportunities anticipated to fuel the growth of the smart water metering market during the forecast period 2019–2025.
Additionally, utilities operating in developed economies are mandated to meet certain guidelines and standards to eliminate the commercial loss – water that is incorrectly billed because of poor/incorrect metering and physical loss – leaks and theft from the water distribution system, which is further accelerating the growth of the smart water metering market. Moreover, advancement in IoT and sensing technologies, declining deployment cost of IoT solutions, and increasing focus on utilizing data-driven solutions to improve operating revenue of utilities are further fuelling the growth of smart water metering market.
Market Revenue and Segmentation Analysis Smart Water Metering Market
The global smart water metering market is anticipated to grow at a CAGR of 13.3% during the forecast period 2019–2025.
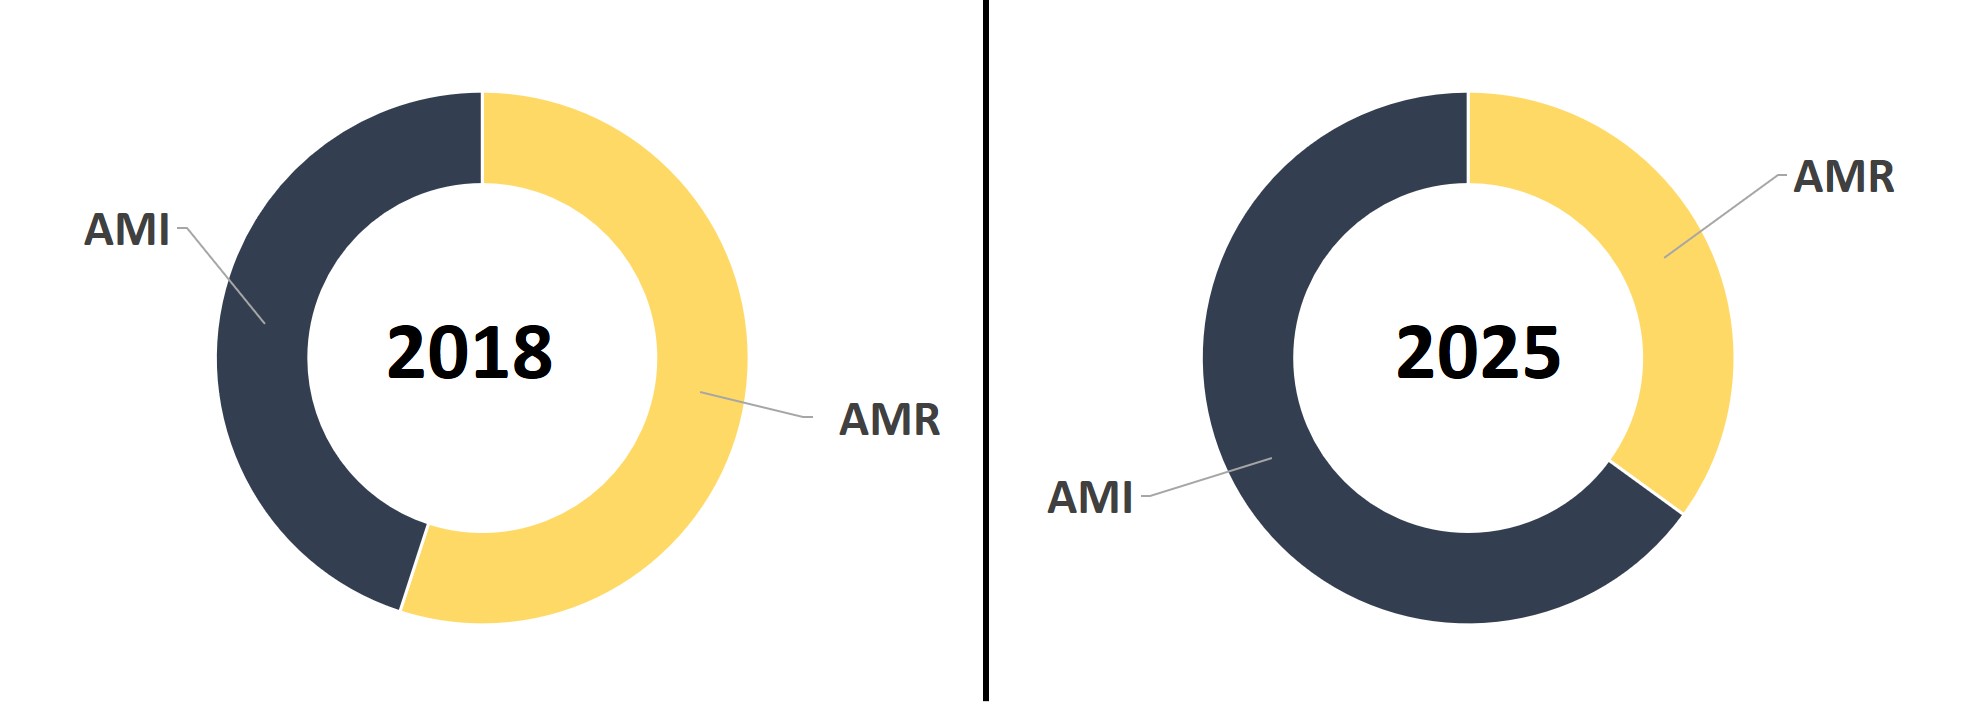
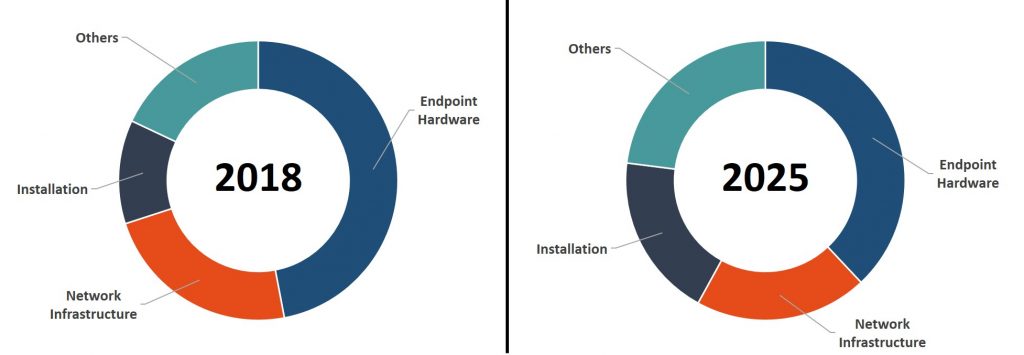
The global smart water metering market is segmented based on type, component, and region. In terms of type, the global smart water metering market is sub-segmented into automated meter reading (AMR) and advanced metering infrastructure (AMI). The AMR segment dominated in 2018 and is expected to lose its market share to the AMI segment during the forecast period. This is primarily due to higher operating costs of AMR when compared to AMI since meter readers must still drive the routes. The AMI system offers various water management capabilities such as enhanced tracking of flow patterns and water consumption, ability to monitor changes in demands and trends, and abnormalities in distribution network among others. By type, AMI is anticipated to be the fastest growing segment attributed to its advanced water management capabilities of AMI system and increasing interest on smart grid solutions. In terms of component, the global smart water metering market is sub-segmented into endpoint hardware, network infrastructure, installation, and others.
Regional Analysis
In 2018, the Americas was the dominant region in the global smart water metering market followed by Europe. Asia Pacific is identified as the fastest growing region in the global smart water metering market, i.e., growing at a CAGR of 20.8% during the forecast period 2019–2025. This is mainly due to rapid urbanization and expanding urban landscape along with increasing investment in smart city initiatives.
Benefits and Vendors
The report on smart water metering market contains an in-depth analysis of vendors, which includes financial health, business units, key business priorities, SWOT, strategies, and views; and competitive landscape. Few of the key players profiled in this study include Xylem Inc. (Sensus), Itron Inc., Badger Meter, Inc., Kamstrup A/S, Landis+Gyr., Neptune Technology Group, Arad Group, Diehl Stiftung & Co. KG, Hubbell (Aclara Technologies LLC), and Mueller Water Products, Inc.
The study offers a comprehensive analysis of the “global smart water metering market”. Bringing out the complete key insights of the industry, the report aims to provide an insight into the latest trends, current market scenario, and technologies related to the market. In addition, it helps the venture capitalists to understand revenue opportunities across different segments to take better decisions.
Key Segments of the Report Include:
-
Automated Meter Reading (AMR)
-
Advanced Metering Infrastructure (AMI)
-
Endpoint Hardware
-
Network Infrastructure
-
Installation
-
Others
-
Americas
-
Europe
-
Asia Pacific
-
Middle East & Africa (MEA)
1 Executive Summary
2 Industry Outlook
2.1 Industry Overview
2.1.1 Industry Trend
2.1.1.1 Emerging low power IoT connectivity technologies (NB-IoT)
3 Market Snapshot
3.1 Overview
3.1.1 PEST Analysis
3.1.2 Porter’s Five Force Analysis
3.2 Related Markets
4 Market Characteristics
4.1 Market Distribution Structure
4.2 Market Developments
4.3 Market Segmentation
4.4 Market Dynamics
4.4.1 Drivers
4.4.1.1 Increasing importance of reducing Non-Revenue Water
4.4.1.2 Transformation of aging water infrastructure with smart devices for resource sustainability
4.4.1.3 Utilities pressurized to reduce operating cost
4.4.2 Restraints
4.4.2.1 Lack of IT knowledge and complexity in integrating with existing infrastructure
4.4.2.2 Lack of political and regulatory support in developing economies
4.4.3 Opportunities
4.4.3.1 Increased focus on water-related smart city initiatives
4.4.3.2 Expanding urban landscape in developing economies
4.4.4 DRO – Impact Analysis
5 Smart Water Metering Market, By Type
5.1 Overview
5.2 Automatic meter reading (AMR)
5.3 Advanced metering infrastructure (AMI)
6 Global Smart Water Metering Market, By Component
6.1 Overview
6.2 Endpoint Hardware
6.3 Network Infrastructure
6.4 Installation
6.5 Others
7 Global Smart Water Metering Market, By Region
7.1 Overview
7.2 Americas
7.2.1 Overview
7.2.2 By Type – Market Size and Analysis
7.2.3 By Component – Market Size and Analysis
7.3 Europe
7.3.1 Overview
7.3.2 By Type – Market Size and Analysis
7.3.3 By Component – Market Size and Analysis
7.4 Asia Pacific
7.4.1 Overview
7.4.2 By Type – Market Size and Analysis
7.4.3 By Component – Market Size and Analysis
7.5 Middle East & Africa (MEA)
7.5.1 Overview
7.5.2 By Product Type – Market Size and Analysis
7.5.3 By Component – Market Size and Analysis
8 Vendor Profiles
8.1 Xylem Inc.(Sensus)
8.1.1 Company Description
8.1.2 Business Analysis
8.1.2.1 Strategic Snapshot
8.1.2.2 Business Impact Analysis
8.1.2.3 Operational Snapshot
8.1.2.4 Product/Service Portfolio
8.2 Itron Inc.
8.2.1 Company Description
8.2.2 Business Analysis
8.2.2.1 Strategic Snapshot
8.2.2.2 Business Impact Analysis
8.2.2.3 Operational Snapshot
8.2.2.4 Product/Service Portfolio
8.3 Badger Meter, Inc.
8.3.1 Company Description
8.3.2 Business Analysis
8.3.2.1 Strategic Snapshot
8.3.2.2 Business Impact Analysis
8.3.2.3 Operational Snapshot
8.3.2.4 Product/Service Portfolio
8.4 Kamstrup A/S
8.4.1 Company Description
8.4.2 Business Analysis
8.4.2.1 Strategic Snapshot
8.4.2.2 Business Impact Analysis
8.4.2.3 Operational Snapshot
8.4.2.4 Product/Service Portfolio
8.5 Landis+Gyr.
8.5.1 Company Description
8.5.2 Business Analysis
8.5.2.1 Strategic Snapshot
8.5.2.2 Business Impact Analysis
8.5.2.3 Operational Snapshot
8.5.2.4 Product/Service Portfolio
9 Companies to Watch for
9.1 Neptune Technology Group Inc
9.1.1 Company Description
9.1.2 Business Analysis
9.1.2.1 Strategic Snapshot
9.1.2.2 Operational Snapshot
9.1.2.3 Product/Service Portfolio
9.2 Arad Group
9.2.1 Company Description
9.2.2 Business Analysis
9.2.2.1 Strategic Snapshot
9.2.2.2 Operational Snapshot
9.2.2.3 Product/Service Portfolio
9.3 Diehl Stiftung & Co. KG
9.3.1 Company Description
9.3.2 Business Analysis
9.3.2.1 Strategic Snapshot
9.3.2.2 Business Impact Analysis
9.3.2.3 Operational Snapshot
9.3.2.4 Product/Service Portfolio
9.4 Hubbell (Aclara Technologies LLC.)
9.4.1 Company Description
9.4.2 Business Analysis
9.4.2.1 Strategic Snapshot
9.4.2.2 Operational Snapshot
9.4.2.3 Product/Service Portfolio
9.5 Mueller Water Products, Inc.
9.5.1 Company Description
9.5.1.1 Product/Service Portfolio
10 Annexure
10.1 Report Scope
10.2 Research Methodology
10.2.1 Data Collation & In-house Estimation
10.2.2 Market Triangulation
10.2.3 Forecasting
10.3 Study Declarations
10.4 Report Assumptions
10.5 Abbreviations
Research Framework
Infoholic research works on a holistic 360° approach in order to deliver high quality, validated and reliable information in our market reports. The Market estimation and forecasting involves following steps:
- Data Collation (Primary & Secondary)
- In-house Estimation (Based on proprietary data bases and Models)
- Market Triangulation
- Forecasting

Market related information is congregated from both primary and secondary sources.
Primary sources
involved participants from all global stakeholders such as Solution providers, service providers, Industry associations, thought leaders etc. across levels such as CXOs, VPs and managers. Plus, our in-house industry experts having decades of industry experience contribute their consulting and advisory services.
Secondary sources
include public sources such as regulatory frameworks, government IT spending, government demographic indicators, industry association statistics, and company publications along with paid sources such as Factiva, OneSource, Bloomberg among others.
![]()