
Thin film and Printed Battery Market by Battery Type (Disposable and Rechargeable), Voltage (Below 1.5V, 1.5V to 3V and above 3V), Application (Wearable Devices, Medical, Consumer Electronics, Smart Cards, and Others) and Geography–Global Forecast up to 2026
- May, 2021
- Domain: Electronics & Semiconductors - Electronics & Semiconductors
- Get Free 10% Customization in this Report
Thin film and the printed battery is a new generation technology that delivers power compatibility for less-power disposable applications. These batteries are safer in terms of economical and environmentally when compared to lithium batteries and are adapted in a wide range of applications. Thin film and printed batteries are usually used in biometric monitoring devices, perishable goods monitoring, sports monitoring devices, wearables electronics, biosensors, smart labels & tags, and many more. The increasing necessity of thin-film and printed batteries in the healthcare sector and the rising penetration of wearable electronic devices such as smart clothes, smartwatches, glasses, and e-textiles are few key factors fostering the thin film and printed battery market globally. Personal care, pharmaceutical & medical devices, and cosmetic patches are key industries benefiting from thin film and printed batteries. On the contrary, the huge initial investment in developing printed flexible batteries is restricting the thin film and printed battery market. The Thin-film and Printed Battery Market is evaluated to reach the rate of 24.6% CAGR by 2026.
Research Methodology:
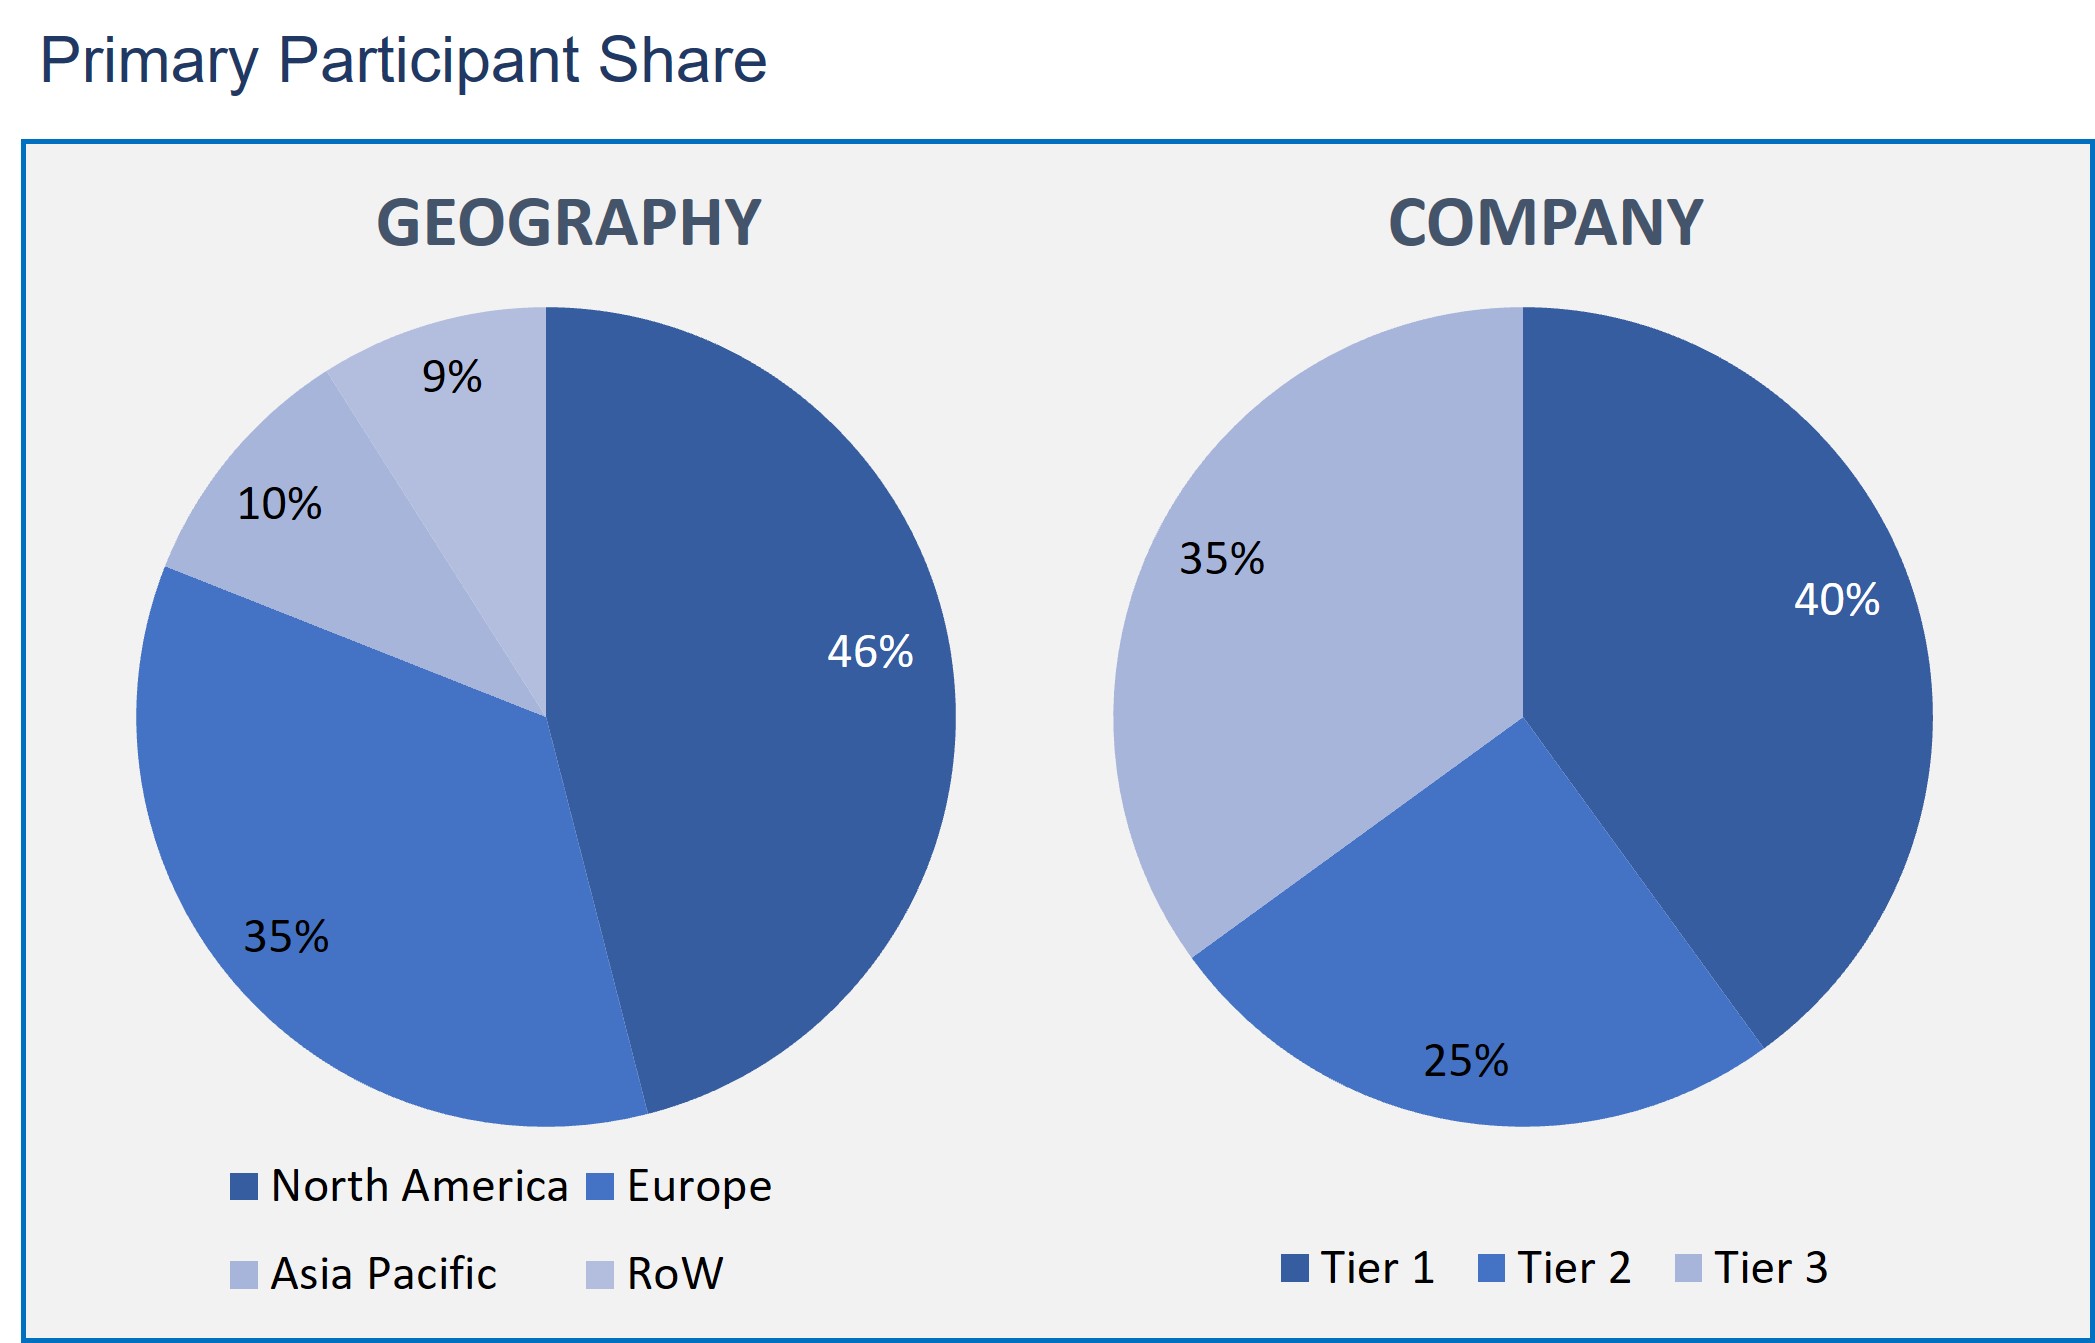
The Thin-film and the printed battery Market has been analyzed by utilizing the optimum combination of secondary sources and in-house methodology and a unique balance of primary insights. The real-time valuation of the market is an integral part of our forecasting and market sizing methodology. Industry experts and our primary participants have helped to compile related aspects with accurate parametric estimations for a complete study. The primary participants share is given below:
Thin film and Printed Battery Market By Battery Type
- Disposable
- Rechargeable
Thin film and Printed Battery Market By Voltage
- Below 1.5V
- 1.5V to 3V
- Above 3V
Thin film and Printed Battery Market By Application
- Wearable Devices
- Medical
- Consumer Electronics
- Smart Cards
- Others
Thin film and Printed Battery Market by Geography
- North America
- Europe
- Asia Pacific
- Rest of the World
As in the thin film and printed battery market for battery type, the rechargeable type segment has the major share in the market. Rechargeable batteries are mostly suitable for consumer electronics devices and are used in medical devices, wireless sensors, and wearable devices. A continuous research and development activity by several research institutions and companies to cut down the overall costs of these batteries is also anticipated to fuel the segment growth over the upcoming years.
The market is further segmented by voltage. The 1.5 v type is the dominant segment in this segmentation. This is due to the huge demand for the below 1.5 v thin-film batteries from various applications such as smart cards, toys, medical patches, and RFID tags.
As per the application of thin-film and printed batteries, these batteries are mostly used in wearable devices, including fitness trackers, smart clothing, and other devices, since these devices have limited space. This is due to the enhanced recharging rate, compact design of the thin film & printed battery, and it is safe compared to other lithium batteries. The factors mentioned above are boosting the growth of the market in this segment.
Based on geography, the North American region substantially contributes to the thin film and printed battery market. This is attributed to the increasing research and development activities and technological innovations in this region. Increasing demand for wearable devices is the key factor contributing to the market growth in this region.
The rising deployment of wireless healthcare monitoring systems and mobile medical devices plays a very prominent role in the growth of the thin film and printed battery market globally. Various hospitals are adapting numerous technologies such as mobile health applications, sensors, and remote patient monitoring to enhance healthcare delivery. Moreover, surging demand for small-sized batteries with better energy storage will again propel the global market growth.
The major vendors of the thin film and printed battery market are as follows-Fullriver Battery New Technology Co., Ltd., Samsung SDI Co., Ltd., Enfucell Oy Ltd., Ultralife Corporation, Blue Spark Technologies, BrightVolt, Inc., LG Chem Ltd., Apple Inc., and Panasonic Corporation.
Henceforth, the usual secondary batteries may fulfill the energy requirements of wearable devices, but they struggle to obtain flexibility, thinness, and lightweight. Since the thin film and printed batteries are the solutions for the above requirements for small devices.
- The study describes the inclusive analysis of the thin film and printed battery market size with the recent trends and future estimations to explain the impending investment pockets.
- A comprehensive analysis of the aspects which accelerate and retrain the market size is also included in this report.
- The market’s quantitative analysis is provided to assist shareholders in capitalizing on the possible market opportunities.
- This study further includes an extensive analysis of the market's key segments, which helps to understand the market trends.
- Executive Summary
- Industry Outlook
- Industry Overview
- Industry Trends
- Market Snapshot
- Market Definition
- Market Outlook
- Porter Five Forces
- Related Markets
- Market characteristics
- Market Overview
- Market Segmentation
- Market Dynamics
- Drivers
- Restraints
- Opportunities
- DRO - Impact Analysis
- Battery Type: Market Size & Analysis
- Overview
- Disposable
- Rechargeable
- Voltage: Market Size & Analysis
- Overview
- Below 1.5V
- 1.5V to 3V
- Above 3V
- Application: Market Size & Analysis
- Overview
- Wearable Devices
- Medical
- Consumer Electronics
- Smart Cards
- Others
- Geography: Market Size & Analysis
- Overview
- North America
- Europe
- Asia Pacific
- Rest of the World
- Competitive Landscape
- Competitor Comparison Analysis
- Market Developments
- Mergers and Acquisitions, Legal, Awards, Partnerships
- Product Launches and execution
- Vendor Profiles
- Fullriver Battery New Technology Co., Ltd.
- Overview
- Financial Overview
- Product Offerings
- Developments
- Business Strategy
- Samsung SDI Co., Ltd.
- Overview
- Financial Overview
- Product Offerings
- Developments
- Business Strategy
- Enfucell Oy Ltd.
- Overview
- Financial Overview
- Product Offerings
- Developments
- Business Strategy
- Ultralife Corporation
- Overview
- Financial Overview
- Product Offerings
- Developments
- Business Strategy
- Blue Spark Technologies
- Overview
- Financial Overview
- Product Offerings
- Developments
- Business Strategy
- BrightVolt, Inc.
- Overview
- Financial Overview
- Product Offerings
- Developments
- Business Strategy
- LG Chem Ltd.
- Overview
- Financial Overview
- Product Offerings
- Developments
- Business Strategy
- Apple Inc.
- Overview
- Financial Overview
- Product Offerings
- Developments
- Business Strategy
- Panasonic Corporation
- Overview
- Financial Overview
- Product Offerings
- Developments
- Business Strategy
- Fullriver Battery New Technology Co., Ltd.
- Analyst Opinion
- Annexure
- Report Scope
- Market Definitions
- Research Methodology
- Data Collation and In-house Estimation
- Market Triangulation
- Forecasting
- Report Assumptions
- Declarations
- Stakeholders
- Abbreviations
TABLE 1. GLOBAL THIN FILM AND PRINTED BATTERY MARKET VALUE, BY BATTERY TYPE, 2020-2026 (USD BILLION)
TABLE 2. GLOBAL THIN FILM AND PRINTED BATTERY MARKET VALUE FOR DISPOSABLE, BY GEOGRAPHY, 2020-2026 (USD BILLION)
TABLE 3. GLOBAL THIN FILM AND PRINTED BATTERY MARKET VALUE FOR RECHARGEABLE, BY GEOGRAPHY, 2020-2026 (USD BILLION)
TABLE 4. GLOBAL THIN FILM AND PRINTED BATTERY MARKET VALUE, BY VOLTAGE, BY GEOGRAPHY, 2020-2026 (USD BILLION)
TABLE 5. GLOBAL THIN FILM AND PRINTED BATTERY MARKET VALUE FOR BELOW 1.5V, BY GEOGRAPHY, 2020-2026 (USD BILLION)
TABLE 6. GLOBAL THIN FILM AND PRINTED BATTERY MARKET VALUE FOR 1.5V TO 3V, BY GEOGRAPHY, 2020-2026 (USD BILLION)
TABLE 7. GLOBAL THIN FILM AND PRINTED BATTERY MARKET VALUE FOR ABOVE 3V, BY GEOGRAPHY, 2020-2026 (USD BILLION)
TABLE 8. GLOBAL THIN FILM AND PRINTED BATTERY MARKET VALUE, BY APPLICATION, 2020-2026 (USD BILLION)
TABLE 9. GLOBAL THIN FILM AND PRINTED BATTERY MARKET VALUE FOR WEARABLE DEVICES, BY GEOGRAPHY, 2020-2026 (USD BILLION)
TABLE 10. GLOBAL THIN FILM AND PRINTED BATTERY MARKET VALUE FOR MEDICAL, BY GEOGRAPHY, 2020-2026 (USD BILLION)
TABLE 11. GLOBAL THIN FILM AND PRINTED BATTERY MARKET VALUE FOR CONSUMER ELECTRONICS, BY GEOGRAPHY, 2020-2026 (USD BILLION)
TABLE 12. GLOBAL THIN FILM AND PRINTED BATTERY MARKET VALUE FOR SMART CARDS, BY GEOGRAPHY, 2020-2026 (USD BILLION)
TABLE 13. GLOBAL THIN FILM AND PRINTED BATTERY MARKET VALUE FOR OTHERS, BY GEOGRAPHY, 2020-2026 (USD BILLION)
TABLE 14. NORTH AMERICA THIN FILM AND PRINTED BATTERY MARKET VALUE, BY COUNTRY, 2020-2026 (USD BILLION)
TABLE 15. NORTH AMERICA THIN FILM AND PRINTED BATTERY MARKET VALUE, BY BATTERY TYPE, 2020-2026 (USD BILLION)
TABLE 16. NORTH AMERICA THIN FILM AND PRINTED BATTERY MARKET VALUE, BY VOLTAGE, 2020-2026 (USD BILLION)
TABLE 17. NORTH AMERICA THIN FILM AND PRINTED BATTERY MARKET VALUE, BY APPLICATION, 2020-2026 (USD BILLION)
TABLE 18. U.S THIN FILM AND PRINTED BATTERY MARKET VALUE, BY BATTERY TYPE, 2020-2026 (USD BILLION)
TABLE 19. U.S THIN FILM AND PRINTED BATTERY MARKET VALUE, BY VOLTAGE, 2020-2026 (USD BILLION)
TABLE 20. U.S THIN FILM AND PRINTED BATTERY MARKET VALUE, BY APPLICATION, 2020-2026 (USD BILLION)
TABLE 21. CANADA THIN FILM AND PRINTED BATTERY MARKET VALUE, BY BATTERY TYPE, 2020-2026 (USD BILLION)
TABLE 22. CANADA THIN FILM AND PRINTED BATTERY MARKET VALUE, BY VOLTAGE, 2020-2026 (USD BILLION)
TABLE 23. CANADA THIN FILM AND PRINTED BATTERY MARKET VALUE, BY APPLICATION, 2020-2026 (USD BILLION)
TABLE 24. EUROPE THIN FILM AND PRINTED BATTERY MARKET VALUE, BY COUNTRY, 2020-2026 (USD BILLION)
TABLE 25. EUROPE THIN FILM AND PRINTED BATTERY MARKET VALUE, BY BATTERY TYPE, 2020-2026 (USD BILLION)
TABLE 26. EUROPE THIN FILM AND PRINTED BATTERY MARKET VALUE, BY VOLTAGE, 2020-2026 (USD BILLION)
TABLE 27. EUROPE THIN FILM AND PRINTED BATTERY MARKET VALUE, APPLICATION, 2020-2026 (USD BILLION)
TABLE 28. GERMANY THIN FILM AND PRINTED BATTERY MARKET VALUE, BY BATTERY TYPE, 2020-2026 (USD BILLION)
TABLE 29. GERMANY THIN FILM AND PRINTED BATTERY MARKET VALUE, BY VOLTAGE, 2020-2026 (USD BILLION)
TABLE 30. GERMANY THIN FILM AND PRINTED BATTERY MARKET VALUE, BY APPLICATION, 2020-2026 (USD BILLION)
TABLE 31. U.K THIN FILM AND PRINTED BATTERY MARKET VALUE, BY BATTERY TYPE, 2020-2026 (USD BILLION)
TABLE 32. U.K THIN FILM AND PRINTED BATTERY MARKET VALUE, BY VOLTAGE, 2020-2026 (USD BILLION)
TABLE 33. U.K THIN FILM AND PRINTED BATTERY MARKET VALUE, BY APPLICATION, 2020-2026 (USD BILLION)
TABLE 34. FRANCE THIN FILM AND PRINTED BATTERY MARKET VALUE, BY BATTERY TYPE, 2020-2026 (USD BILLION)
TABLE 35. FRANCE THIN FILM AND PRINTED BATTERY MARKET VALUE, BY VOLTAGE, 2020-2026 (USD BILLION)
TABLE 36. FRANCE THIN FILM AND PRINTED BATTERY MARKET VALUE, BY APPLICATION, 2020-2026 (USD BILLION)
TABLE 37. ITALY THIN FILM AND PRINTED BATTERY MARKET VALUE, BY BATTERY TYPE, 2020-2026 (USD BILLION)
TABLE 38. ITALY THIN FILM AND PRINTED BATTERY MARKET VALUE, BY VOLTAGE, 2020-2026 (USD BILLION)
TABLE 39. ITALY THIN FILM AND PRINTED BATTERY MARKET VALUE, BY APPLICATION, 2020-2026 (USD BILLION)
TABLE 40. SPAIN THIN FILM AND PRINTED BATTERY MARKET VALUE, BY BATTERY TYPE, 2020-2026 (USD BILLION)
TABLE 41. SPAIN THIN FILM AND PRINTED BATTERY MARKET VALUE, BY VOLTAGE, 2020-2026 (USD BILLION)
TABLE 42. SPAIN THIN FILM AND PRINTED BATTERY MARKET VALUE, BY APPLICATION, 2020-2026 (USD BILLION)
TABLE 43. ROE THIN FILM AND PRINTED BATTERY MARKET VALUE, BY BATTERY TYPE, 2020-2026 (USD BILLION)
TABLE 44. ROE THIN FILM AND PRINTED BATTERY MARKET VALUE, BY VOLTAGE, 2020-2026 (USD BILLION)
TABLE 45. ROE THIN FILM AND PRINTED BATTERY MARKET VALUE, BY APPLICATION, 2020-2026 (USD BILLION)
TABLE 46. ASIA PACIFIC THIN FILM AND PRINTED BATTERY MARKET VALUE, BY COUNTRY, 2020-2026 (USD BILLION)
TABLE 47. ASIA PACIFIC THIN FILM AND PRINTED BATTERY MARKET VALUE, BY BATTERY TYPE, 2020-2026 (USD BILLION)
TABLE 48. ASIA PACIFIC THIN FILM AND PRINTED BATTERY MARKET VALUE, BY VOLTAGE, 2020-2026 (USD BILLION)
TABLE 49. ASIA PACIFIC THIN FILM AND PRINTED BATTERY MARKET VALUE, BY APPLICATION, 2020-2026 (USD BILLION)
TABLE 50. CHINA THIN FILM AND PRINTED BATTERY MARKET VALUE, BY BATTERY TYPE, 2020-2026 (USD BILLION)
TABLE 51. CHINA THIN FILM AND PRINTED BATTERY MARKET VALUE, BY VOLTAGE, 2020-2026 (USD BILLION)
TABLE 52. CHINA THIN FILM AND PRINTED BATTERY MARKET VALUE, BY APPLICATION, 2020-2026 (USD BILLION)
TABLE 53. INDIA THIN FILM AND PRINTED BATTERY MARKET VALUE, BY BATTERY TYPE, 2020-2026 (USD BILLION)
TABLE 54. INDIA THIN FILM AND PRINTED BATTERY MARKET VALUE, BY VOLTAGE, 2020-2026 (USD BILLION)
TABLE 55. INDIA THIN FILM AND PRINTED BATTERY MARKET VALUE, BY APPLICATION, 2020-2026 (USD BILLION)
TABLE 56. JAPAN THIN FILM AND PRINTED BATTERY MARKET VALUE, BY BATTERY TYPE, 2020-2026 (USD BILLION)
TABLE 57. JAPAN THIN FILM AND PRINTED BATTERY MARKET VALUE, BY VOLTAGE, 2020-2026 (USD BILLION)
TABLE 58. JAPAN THIN FILM AND PRINTED BATTERY MARKET VALUE, BY APPLICATION, 2020-2026 (USD BILLION)
TABLE 59. REST OF APAC THIN FILM AND PRINTED BATTERY MARKET VALUE, BY BATTERY TYPE, 2020-2026 (USD BILLION)
TABLE 60. REST OF APAC THIN FILM AND PRINTED BATTERY MARKET VALUE, BY VOLTAGE, 2020-2026 (USD BILLION)
TABLE 61. REST OF APAC THIN FILM AND PRINTED BATTERY MARKET VALUE, BY APPLICATION, 2020-2026 (USD BILLION)
TABLE 62. REST OF WORLD THIN FILM AND PRINTED BATTERY MARKET VALUE, BY BATTERY TYPE, 2020-2026 (USD BILLION)
TABLE 63. REST OF WORLD THIN FILM AND PRINTED BATTERY MARKET VALUE, BY VOLTAGE, 2020-2026 (USD BILLION)
TABLE 64. REST OF WORLD THIN FILM AND PRINTED BATTERY MARKET VALUE, BY APPLICATION, 2020-2026 (USD BILLION)
TABLE 65. FULLRIVER BATTERY NEW TECHNOLOGY CO., LTD: FINANCIALS
TABLE 66. FULLRIVER BATTERY NEW TECHNOLOGY CO., LTD: PRODUCTS & SERVICES
TABLE 67. FULLRIVER BATTERY NEW TECHNOLOGY CO., LTD: RECENT DEVELOPMENTS
TABLE 68. SAMSUNG SDI CO., LTD: FINANCIALS
TABLE 69. SAMSUNG SDI CO., LTD: PRODUCTS & SERVICES
TABLE 70. SAMSUNG SDI CO., LTD: RECENT DEVELOPMENTS
TABLE 71. ENFUCELL OY LTD: FINANCIALS
TABLE 72. ENFUCELL OY LTD: PRODUCTS & SERVICES
TABLE 73. ENFUCELL OY LTD: RECENT DEVELOPMENTS
TABLE 74. ULTRALIFE CORPORATION: FINANCIALS
TABLE 75. ULTRALIFE CORPORATION: PRODUCTS & SERVICES
TABLE 76. ULTRALIFE CORPORATION: RECENT DEVELOPMENTS
TABLE 77. BLUE SPARK TECHNOLOGIES: FINANCIALS
TABLE 78. BLUE SPARK TECHNOLOGIES: PRODUCTS & SERVICES
TABLE 79. BLUE SPARK TECHNOLOGIES: RECENT DEVELOPMENTS
TABLE 80. BRIGHTVOLT, INC: FINANCIALS
TABLE 81. BRIGHTVOLT, INC: PRODUCTS & SERVICES
TABLE 82. BRIGHTVOLT, INC: RECENT DEVELOPMENTS
TABLE 83. LG CHEM LTD: FINANCIALS
TABLE 84. LG CHEM LTD: PRODUCTS & SERVICES
TABLE 85. LG CHEM LTD: RECENT DEVELOPMENTS
TABLE 86. APPLE INC: FINANCIALS
TABLE 87. APPLE INC: PRODUCTS & SERVICES
TABLE 88. APPLE INC: RECENT DEVELOPMENTS
TABLE 89. PANASONIC CORPORATION: FINANCIALS
TABLE 90. PANASONIC CORPORATION: PRODUCTS & SERVICES
TABLE 91. PANASONIC CORPORATION: RECENT DEVELOPMENTS
Research Framework
Infoholic Research works on a holistic 360° approach in order to deliver high quality, validated and reliable information in our market reports. The Market estimation and forecasting involves following steps:
- Data Collation (Primary & Secondary)
- In-house Estimation (Based on proprietary data bases and Models)
- Market Triangulation
- Forecasting

Market related information is congregated from both primary and secondary sources.
Primary sources
Involved participants from all global stakeholders such as Solution providers, service providers, Industry associations, thought leaders etc. across levels such as CXOs, VPs and managers. Plus, our in-house industry experts having decades of industry experience contribute their consulting and advisory services.
Secondary sources
Include public sources such as regulatory frameworks, government IT spending, government demographic indicators, industry association statistics, and company publications along with paid sources such as Factiva, OneSource, Bloomberg among others.
![]()


