
Global Smartwatch Market as per Products (Extension, Standalone, Classical), Application (Personal Assistance, Wellness, Medical/Health, Sports and Others), Operating System (Android, IOS, Windows and Others), and Geography – Global Forecast up to 2026
- April, 2021
- Domain: ICT - smart technologies
- Get Free 10% Customization in this Report
Smartwatches are considered either on their own or paired with a smartphone to deliver features, including making calls, checking caller ID, messaging via text or video, internet, fitness monitoring capabilities, accessing stock & weather updates, and offering GPS coordinates & location directions, and much more. A wearable computing device that closely competitions a wristwatch or any other time-keeping gadget is known as a smartwatch. Other than these features of a watch, most of the smartwatches are Bluetooth-enabled, increasing the capabilities of the wearer's smartphone and connecting it with the smartwatch. The product's wearer can now utilize the watch's interface to read text messages or email, accept or reject calls, use digital assistants, listen to music, and dictate text messages or emails. Such advanced features are expected to support the development of the global smartwatches market in the years to come. The Smartwatch Market is anticipated to grow at a CAGR of 19.5% by 2026.
Research Methodology:
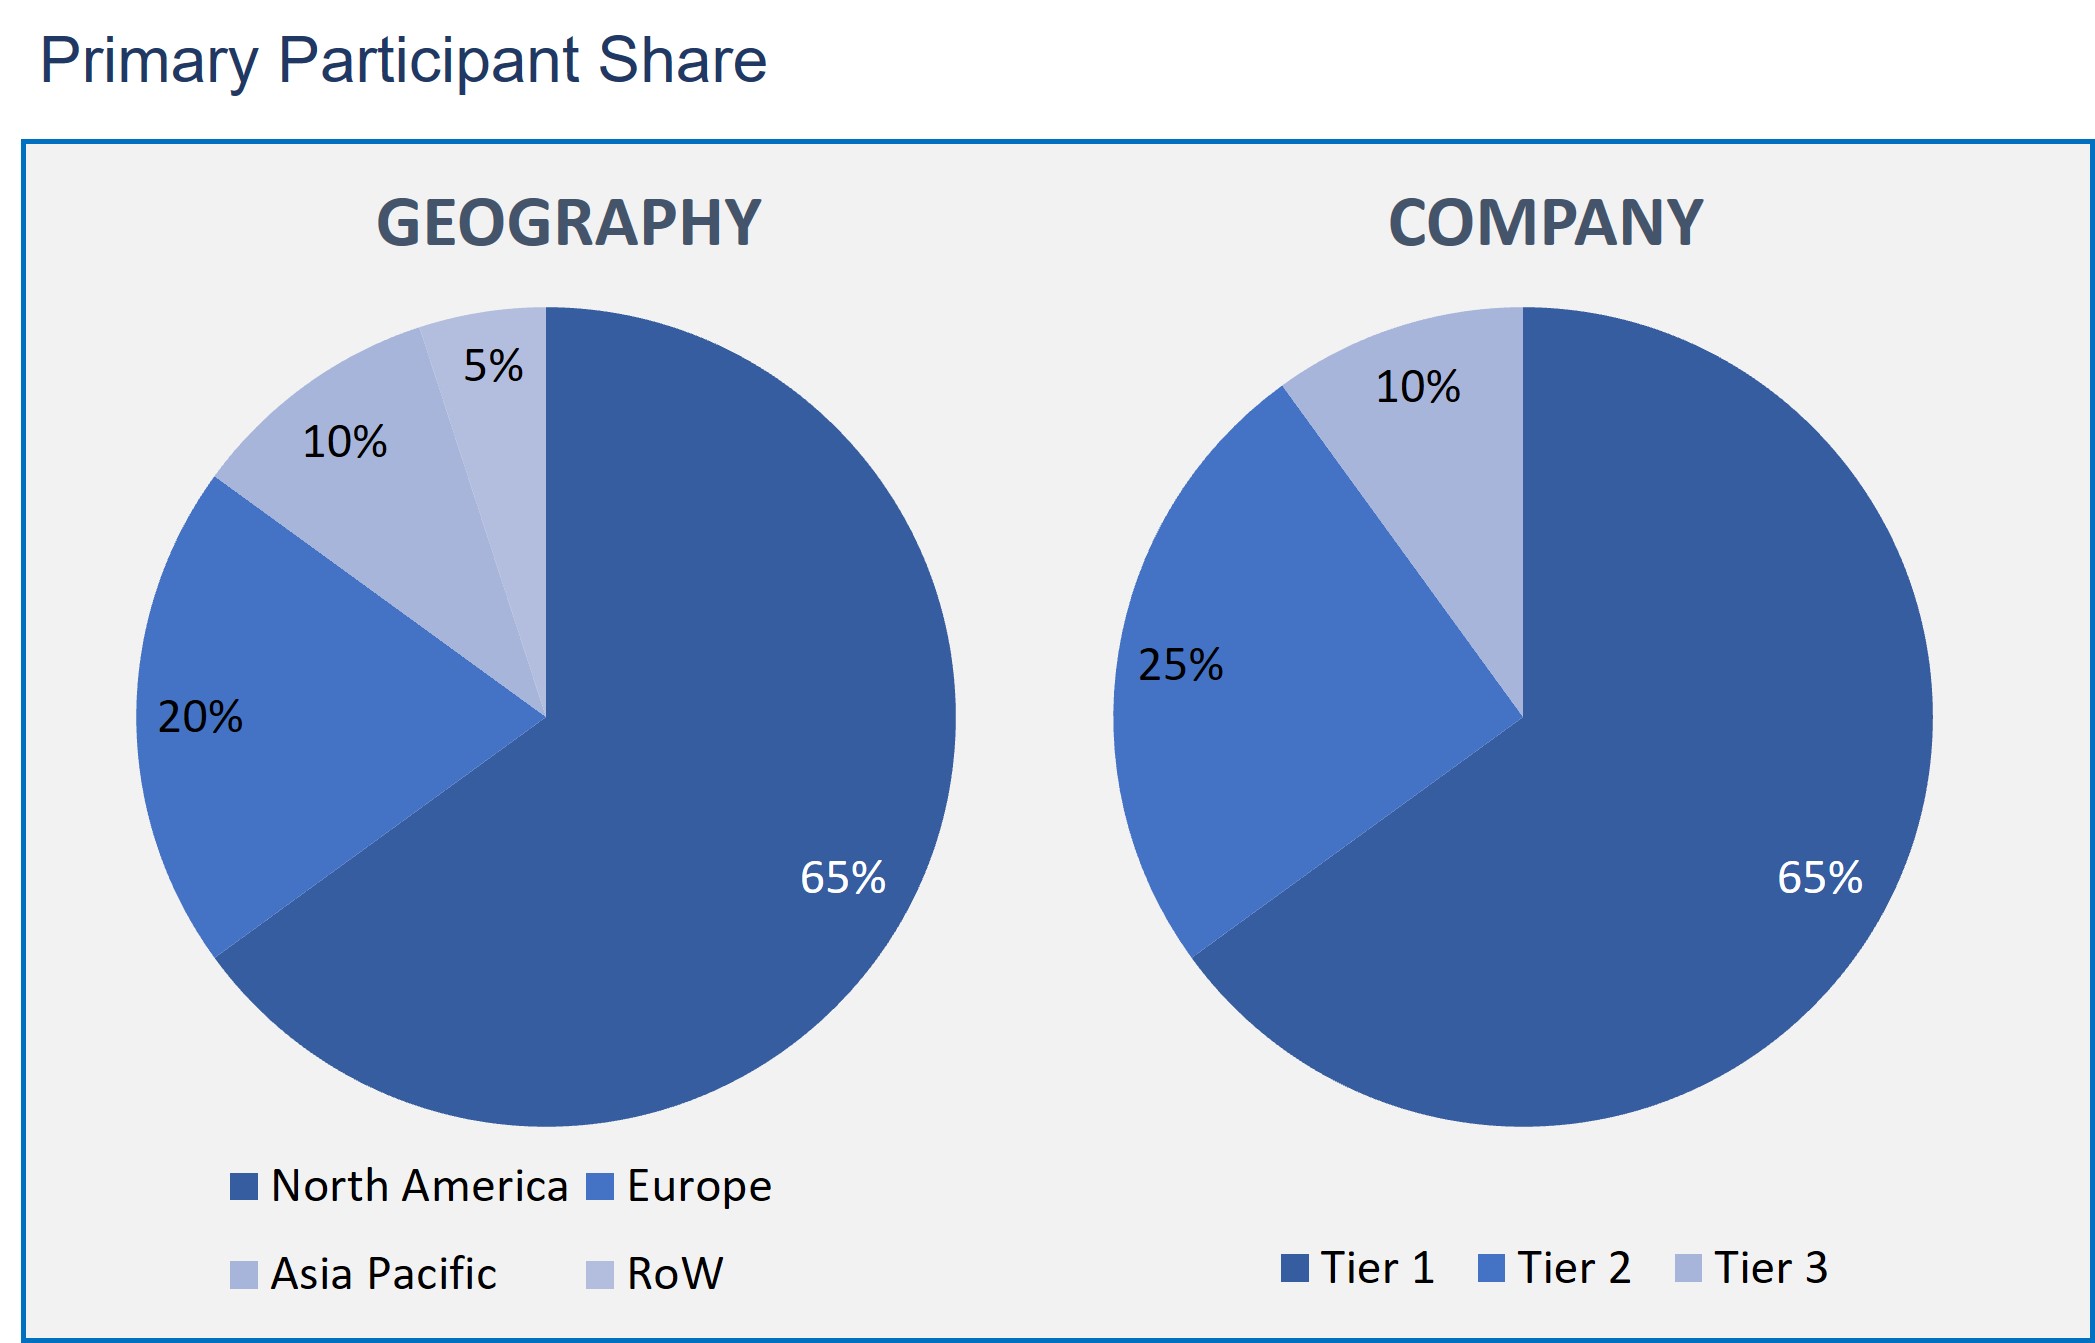
The Smartwatch Market has been analyzed by utilizing the optimum combination of secondary sources and in-house methodology and a unique balance of primary insights. The real-time valuation of the market is an integral part of our forecasting and market sizing methodology. Industry experts and our primary participants have helped to compile related aspects with accurate parametric estimations for a complete study. The primary participants share is given below:
Smartwatch Market by Application
- Healthcare
- Sports
- Personal Assistance
- Wellness
- Others
Smartwatch Market by Product
- Standalone
- Classical
- Extension
Smartwatch Market by Operating System
- Android
- IOS
- Windows
- Others
Smartwatch Market by Geography
- North America
- Europe
- Asia Pacific
- Rest of the World
Based on End-users, development in demand for connected & smart systems and huge investment by the government in building smart cities are the major key areas that drive smart wearables. These smart wearables are used to make a call, message alert, play games, listen to music, and others. The mobile phone can be easily retrieved through the smartphone.
The Asia-Pacific is anticipated to witness the highest development in the smartwatch market due to the rising consumer electronics industry, coupled with a rapid rise of smartwatch market vendors across the region's emerging economies. A growing tech-savvy population, an increasing pool of chronic diseases, such as obesity and diabetes, and growing awareness to maintain a healthy lifestyle drive market growth.
This report gives the profiles of companies leading the Smartwatch market: Apple Inc., Fitbit Inc., and Samsung Electronics Co. Ltd, among others.
- This report offers an overall analysis of the Smartwatch market growth drivers, restraints, opportunities, and other related challenges.
- This report depicts the market developments such as new product launches, mergers and acquisitions, diversification, and joint ventures of the market players.
- This report also describes all potential segments and sub-segments present in the market to help the companies in strategic business planning.
- This report also gives the regional analysis of the Smartwatch market in terms of market penetration across the world.
- Executive Summary
- Industry Outlook
- Industry Overview
- Industry Trends
- Market Snapshot
- Market Definition
- Market Outlook
- Porter Five Forces
- Related Markets
- Market characteristics
- Market Overview
- Market Segmentation
- Market Dynamics
- Drivers
- Restraints
- Opportunities
- DRO - Impact Analysis
- Products: Market Size & Analysis
- Overview
- Extension Smartwatch
- Standalone Smartwatch
- Classical Smartwatch
- Application: Market Size & Analysis
- Overview
- Personal Assistance
- Wellness
- Medical/health
- Sports
- Others
- Operating System: Market Size & Analysis
- Overview
- Android
- IOS
- Windows
- Others
- Geography: Market Size & Analysis
- Overview
- North America
- Europe
- Asia Pacific
- Rest of the World
- Competitive Landscape
- Competitor Comparison Analysis
- Market Developments
- Mergers and Acquisitions, Legal, Awards, Partnerships
- Product Launches and execution
- Vendor Profiles
- Lenovo Group Limited
- Overview
- Financial Overview
- Product End Users
- Developments
- Business Strategy
- Apple Inc
- Overview
- Financial Overview
- Product Offerings
- Developments
- Business Strategy
- Fossil Group, Inc.
- Overview
- Financial Overview
- Product Offerings
- Developments
- Business Strategy
- Polar Electro Oy
- Overview
- Financial Overview
- Product Offerings
- Developments
- Business Strategy
- Samsung Group
- Overview
- Financial Overview
- Product Offerings
- Developments
- Business Strategy
- Fitbit Inc
- Overview
- Financial Overview
- Product Offerings
- Developments
- Business Strategy
- LG Electronics Inc
- Overview
- Financial Overview
- Product Offerings
- Developments
- Business Strategy
- Huawei Technologies Co., Ltd
- Overview
- Financial Overview
- Product Offerings
- Developments
- Business Strategy
- Garmin Ltd
- Overview
- Financial Overview
- Product Offerings
- Developments
- Business Strategy
- AsusTek Computer Inc
- Overview
- Financial Overview
- Product Offerings
- Developments
- Business Strategy
- Lenovo Group Limited
- Analyst Opinion
- Annexure
- Report Scope
- Market Definitions
- Research Methodology
- Data Collation and In-house Estimation
- Market Triangulation
- Forecasting
- Report Assumptions
- Declarations
- Stakeholders
- Abbreviations
TABLE 1. GLOBAL SMARTWATCH MARKET VALUE, BY PRODUCTS, 2020-2026 (USD BILLION)
TABLE 2. GLOBAL SMARTWATCH MARKET VALUE FOR EXTENSION SMARTWATCH, BY GEOGRAPHY, 2020-2026 (USD BILLION)
TABLE 3. GLOBAL SMARTWATCH MARKET VALUE FOR STANDALONE SMARTWATCH, BY GEOGRAPHY, 2020-2026 (USD BILLION)
TABLE 4. GLOBAL SMARTWATCH MARKET VALUE FOR CLASSICAL SMARTWATCH, BY GEOGRAPHY, 2020-2026 (USD BILLION)
TABLE 5. GLOBAL SMARTWATCH MARKET VALUE, BY APPLICATION, 2020-2026 (USD BILLION)
TABLE 6. GLOBAL SMARTWATCH MARKET VALUE FOR PERSONAL ASSISTANCE, BY GEOGRAPHY, 2020-2026 (USD BILLION)
TABLE 7. GLOBAL SMARTWATCH MARKET VALUE FOR WELLNESS, BY GEOGRAPHY, 2020-2026 (USD BILLION)
TABLE 8. GLOBAL SMARTWATCH MARKET VALUE FOR MEDICAL/HEALTH, BY GEOGRAPHY, 2020-2026 (USD BILLION)
TABLE 9. GLOBAL SMARTWATCH MARKET VALUE FOR SPORTS, BY GEOGRAPHY, 2020-2026 (USD BILLION)
TABLE 10. GLOBAL SMARTWATCH MARKET VALUE FOR OTHERS, BY GEOGRAPHY, 2020-2026 (USD BILLION)
TABLE 11. GLOBAL SMARTWATCH MARKET VALUE, BY OPERATING SYSTEM, 2020-2026 (USD BILLION)
TABLE 12. GLOBAL SMARTWATCH MARKET VALUE FOR ANDROID, BY GEOGRAPHY, 2020-2026 (USD BILLION)
TABLE 13. GLOBAL SMARTWATCH MARKET VALUE FOR IOS, BY GEOGRAPHY, 2020-2026 (USD BILLION)
TABLE 14. GLOBAL SMARTWATCH MARKET VALUE FOR WINDOWS, BY GEOGRAPHY, 2020-2026 (USD BILLION)
TABLE 15. GLOBAL SMARTWATCH MARKET VALUE FOR OTHERS, BY GEOGRAPHY, 2020-2026 (USD BILLION)
TABLE 16. NORTH AMERICA SMARTWATCH MARKET VALUE, BY COUNTRY, 2020-2026 (USD BILLION)
TABLE 17. NORTH AMERICA SMARTWATCH MARKET VALUE, BY PRODUCTS, 2020-2026 (USD BILLION)
TABLE 18. NORTH AMERICA SMARTWATCH MARKET VALUE, BY APPLICATION, 2020-2026 (USD BILLION)
TABLE 19. NORTH AMERICA SMARTWATCH MARKET VALUE, BY OPERATING SYSTEM, 2020-2026 (USD BILLION)
TABLE 20. U.S SMARTWATCH MARKET VALUE, BY PRODUCTS, 2020-2026 (USD BILLION)
TABLE 21. U.S SMARTWATCH MARKET VALUE, BY APPLICATION, 2020-2026 (USD BILLION)
TABLE 22. U.S SMARTWATCH MARKET VALUE, BY OPERATING SYSTEM, 2020-2026 (USD BILLION)
TABLE 23. CANADA SMARTWATCH MARKET VALUE, BY PRODUCTS, 2020-2026 (USD BILLION)
TABLE 24. CANADA SMARTWATCH MARKET VALUE, BY APPLICATION, 2020-2026 (USD BILLION)
TABLE 25. CANADA SMARTWATCH MARKET VALUE, BY OPERATING SYSTEM, 2020-2026 (USD BILLION)
TABLE 26. EUROPE SMARTWATCH MARKET VALUE, BY COUNTRY, 2020-2026 (USD BILLION)
TABLE 27. EUROPE SMARTWATCH MARKET VALUE, BY PRODUCTS, 2020-2026 (USD BILLION)
TABLE 28. EUROPE SMARTWATCH MARKET VALUE, BY APPLICATION, 2020-2026 (USD BILLION)
TABLE 29. EUROPE SMARTWATCH MARKET VALUE, OPERATING SYSTEM, 2020-2026 (USD BILLION)
TABLE 30. GERMANY SMARTWATCH MARKET VALUE, BY PRODUCTS, 2020-2026 (USD BILLION)
TABLE 31. GERMANY SMARTWATCH MARKET VALUE, BY APPLICATION, 2020-2026 (USD BILLION)
TABLE 32. GERMANY SMARTWATCH MARKET VALUE, BY OPERATING SYSTEM, 2020-2026 (USD BILLION)
TABLE 33. U.K SMARTWATCH MARKET VALUE, BY PRODUCTS, 2020-2026 (USD BILLION)
TABLE 34. U.K SMARTWATCH MARKET VALUE, BY APPLICATION, 2020-2026 (USD BILLION)
TABLE 35. U.K SMARTWATCH MARKET VALUE, BY OPERATING SYSTEM, 2020-2026 (USD BILLION)
TABLE 36. FRANCE SMARTWATCH MARKET VALUE, BY PRODUCTS, 2020-2026 (USD BILLION)
TABLE 37. FRANCE SMARTWATCH MARKET VALUE, BY APPLICATION, 2020-2026 (USD BILLION)
TABLE 38. FRANCE SMARTWATCH MARKET VALUE, BY OPERATING SYSTEM, 2020-2026 (USD BILLION)
TABLE 39. ITALY SMARTWATCH MARKET VALUE, BY PRODUCTS, 2020-2026 (USD BILLION)
TABLE 40. ITALY SMARTWATCH MARKET VALUE, BY APPLICATION, 2020-2026 (USD BILLION)
TABLE 41. ITALY SMARTWATCH MARKET VALUE, BY OPERATING SYSTEM, 2020-2026 (USD BILLION)
TABLE 42. SPAIN SMARTWATCH MARKET VALUE, BY PRODUCTS, 2020-2026 (USD BILLION)
TABLE 43. SPAIN SMARTWATCH MARKET VALUE, BY APPLICATION, 2020-2026 (USD BILLION)
TABLE 44. SPAIN SMARTWATCH MARKET VALUE, BY OPERATING SYSTEM, 2020-2026 (USD BILLION)
TABLE 45. ROE SMARTWATCH MARKET VALUE, BY PRODUCTS, 2020-2026 (USD BILLION)
TABLE 46. ROE SMARTWATCH MARKET VALUE, BY APPLICATION, 2020-2026 (USD BILLION)
TABLE 47. ROE SMARTWATCH MARKET VALUE, BY OPERATING SYSTEM, 2020-2026 (USD BILLION)
TABLE 48. ASIA PACIFIC SMARTWATCH MARKET VALUE, BY COUNTRY, 2020-2026 (USD BILLION)
TABLE 49. ASIA PACIFIC SMARTWATCH MARKET VALUE, BY PRODUCTS, 2020-2026 (USD BILLION)
TABLE 50. ASIA PACIFIC SMARTWATCH MARKET VALUE, BY APPLICATION, 2020-2026 (USD BILLION)
TABLE 51. ASIA PACIFIC SMARTWATCH MARKET VALUE, BY OPERATING SYSTEM, 2020-2026 (USD BILLION)
TABLE 52. CHINA SMARTWATCH MARKET VALUE, BY PRODUCTS, 2020-2026 (USD BILLION)
TABLE 53. CHINA SMARTWATCH MARKET VALUE, BY APPLICATION, 2020-2026 (USD BILLION)
TABLE 54. CHINA SMARTWATCH MARKET VALUE, BY OPERATING SYSTEM, 2020-2026 (USD BILLION)
TABLE 55. INDIA SMARTWATCH MARKET VALUE, BY PRODUCTS, 2020-2026 (USD BILLION)
TABLE 56. INDIA SMARTWATCH MARKET VALUE, BY APPLICATION, 2020-2026 (USD BILLION)
TABLE 57. INDIA SMARTWATCH MARKET VALUE, BY OPERATING SYSTEM, 2020-2026 (USD BILLION)
TABLE 58. JAPAN SMARTWATCH MARKET VALUE, BY PRODUCTS, 2020-2026 (USD BILLION)
TABLE 59. JAPAN SMARTWATCH MARKET VALUE, BY APPLICATION, 2020-2026 (USD BILLION)
TABLE 60. JAPAN SMARTWATCH MARKET VALUE, BY OPERATING SYSTEM, 2020-2026 (USD BILLION)
TABLE 61. REST OF APAC SMARTWATCH MARKET VALUE, BY PRODUCTS, 2020-2026 (USD BILLION)
TABLE 62. REST OF APAC SMARTWATCH MARKET VALUE, BY APPLICATION, 2020-2026 (USD BILLION)
TABLE 63. REST OF APAC SMARTWATCH MARKET VALUE, BY OPERATING SYSTEM, 2020-2026 (USD BILLION)
TABLE 64. REST OF WORLD SMARTWATCH MARKET VALUE, BY PRODUCTS, 2020-2026 (USD BILLION)
TABLE 65. REST OF WORLD SMARTWATCH MARKET VALUE, BY APPLICATION, 2020-2026 (USD BILLION)
TABLE 66. REST OF WORLD SMARTWATCH MARKET VALUE, BY OPERATING SYSTEM, 2020-2026 (USD BILLION)
TABLE 67. LENOVO GROUP LIMITED: FINANCIALS
TABLE 68. LENOVO GROUP LIMITED: PRODUCTS & SERVICES
TABLE 69. LENOVO GROUP LIMITED: RECENT DEVELOPMENTS
TABLE 70. APPLE INC: FINANCIALS
TABLE 71. APPLE INC: PRODUCTS & SERVICES
TABLE 72. APPLE INC: RECENT DEVELOPMENTS
TABLE 73. FOSSIL GROUP, INC: FINANCIALS
TABLE 74. FOSSIL GROUP, INC: PRODUCTS & SERVICES
TABLE 75. FOSSIL GROUP, INC: RECENT DEVELOPMENTS
TABLE 76. POLAR ELECTRO OY: FINANCIALS
TABLE 77. POLAR ELECTRO OY: PRODUCTS & SERVICES
TABLE 78. POLAR ELECTRO OY: RECENT DEVELOPMENTS
TABLE 79. SAMSUNG GROUP: FINANCIALS
TABLE 80. SAMSUNG GROUP: PRODUCTS & SERVICES
TABLE 81. SAMSUNG GROUP: RECENT DEVELOPMENTS
TABLE 82. FITBIT INC: FINANCIALS
TABLE 83. FITBIT INC: PRODUCTS & SERVICES
TABLE 84. FITBIT INC: RECENT DEVELOPMENTS
TABLE 85. LG ELECTRONICS INC: FINANCIALS
TABLE 86. LG ELECTRONICS INC: PRODUCTS & SERVICES
TABLE 87. LG ELECTRONICS INC: RECENT DEVELOPMENTS
TABLE 88. HUAWEI TECHNOLOGIES CO., LTD: FINANCIALS
TABLE 89. HUAWEI TECHNOLOGIES CO., LTD: PRODUCTS & SERVICES
TABLE 90. HUAWEI TECHNOLOGIES CO., LTD: RECENT DEVELOPMENTS
TABLE 91. GARMIN LTD: FINANCIALS
TABLE 92. GARMIN LTD: PRODUCTS & SERVICES
TABLE 93. GARMIN LTD: RECENT DEVELOPMENTS
TABLE 94. ASUSTEK COMPUTER INC: FINANCIALS
TABLE 95. ASUSTEK COMPUTER INC: PRODUCTS & SERVICES
TABLE 96. ASUSTEK COMPUTER INC: RECENT DEVELOPMENTS
Research Framework
Infoholic Research works on a holistic 360° approach in order to deliver high quality, validated and reliable information in our market reports. The Market estimation and forecasting involves following steps:
- Data Collation (Primary & Secondary)
- In-house Estimation (Based on proprietary data bases and Models)
- Market Triangulation
- Forecasting

Market related information is congregated from both primary and secondary sources.
Primary sources
Involved participants from all global stakeholders such as Solution providers, service providers, Industry associations, thought leaders etc. across levels such as CXOs, VPs and managers. Plus, our in-house industry experts having decades of industry experience contribute their consulting and advisory services.
Secondary sources
Include public sources such as regulatory frameworks, government IT spending, government demographic indicators, industry association statistics, and company publications along with paid sources such as Factiva, OneSource, Bloomberg among others.
![]()


