
Non-Destructive Testing Market by Offering (Non-destructive Testing Services and Non-destructive Testing Equipment), Testing Method (Visual Testing, Liquid Penetrant Testing, Ultrasonic Testing, Magnetic Particle Testing, Eddy Current Testing, and Radiographic Testing), Vertical (Oil & Gas, Aerospace and Defense, Construction, Manufacturing, Automotive, Power Generation and Others) and Geography – Global Forecast up to 2026
- May, 2021
- Domain: ICT - Verticals - Manufacturing
- Get Free 10% Customization in this Report
The increase in manufacturing activities amongst the emerging and the developed nations are projected to drive the non-destructive testing market over the estimated period. Moreover, technological innovations have controlled advanced non-destructive testing processes with enhanced fault detection and safety. Also, growing awareness amongst the manufacturers regarding non-destructive testing is anticipated to expand the penetration of NDT techniques over the estimated period. Projects deploying non-destructive testing techniques are accomplished in a lesser amount of time due to fault detection at complex locations and irregular surfaces. Therefore, considerably reducing the possibility of failures, which, in turn, is expected to fuel their demand over the estimated period. Also, the efficiency of fault detection and the ease of operating ultrasonic equipment, compared to other non-destructive testing equipment, are the main reasons leading to the growing deployment of the ultrasonic test method. The Non-Destructive Testing Market is expected to grow at the rate of 6.9% CAGR by 2026.
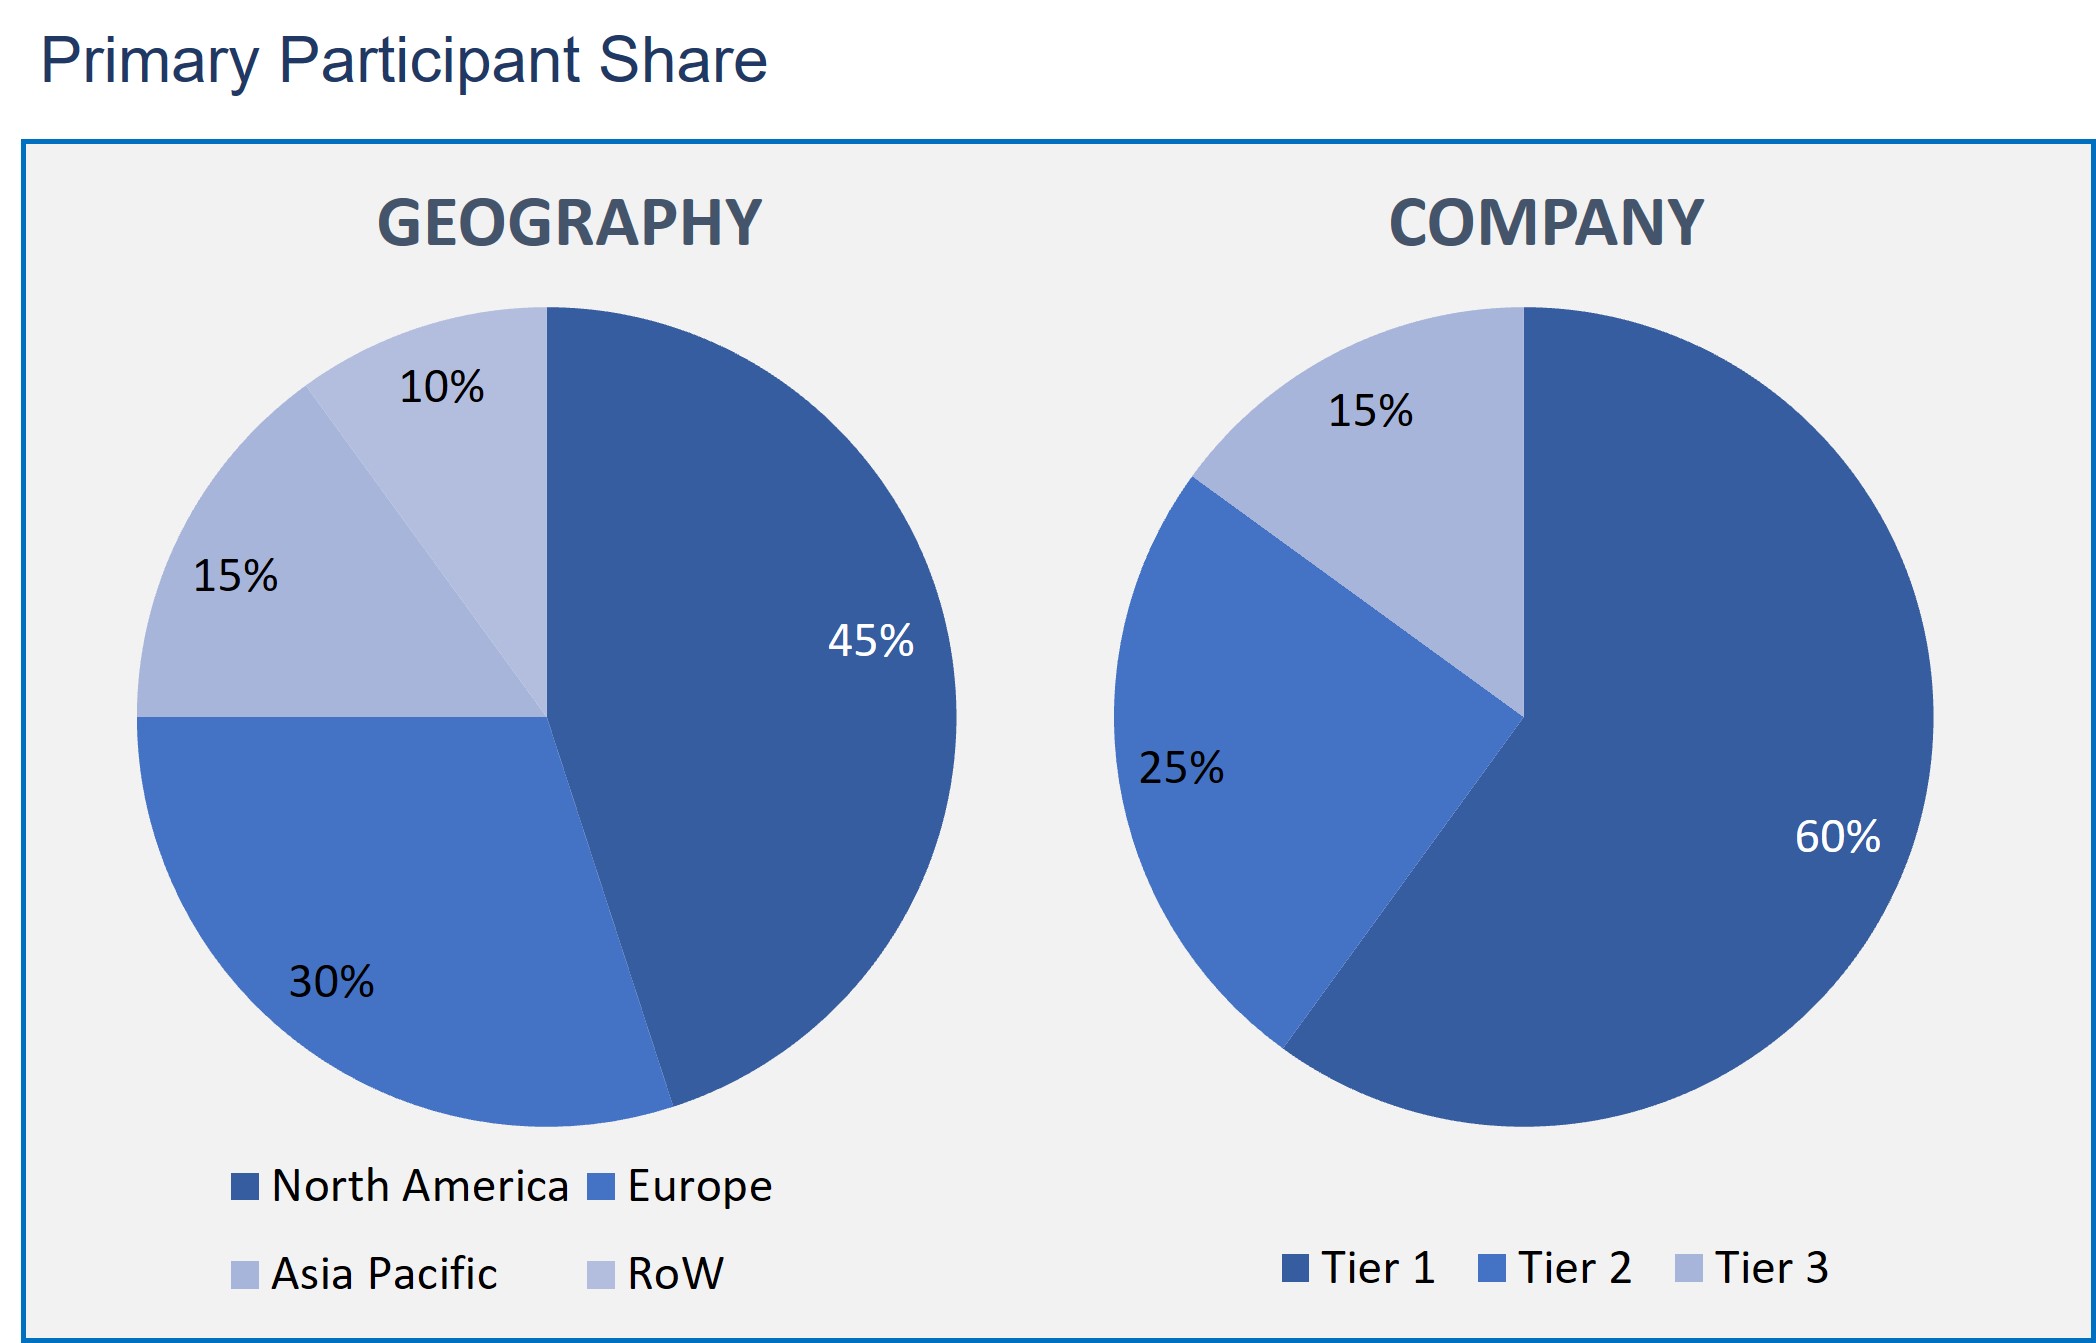
Research Methodology:
The Non-Destructive Testing Market has been analyzed by utilizing the optimum combination of secondary sources and in-house methodology and a unique balance of primary insights. The real-time valuation of the market is an integral part of our forecasting and market sizing methodology. Industry experts and our primary participants have helped to compile related aspects with accurate parametric estimations for a complete study. The primary participants share is given below:
Non-Destructive Testing Market by Vertical
- Oil & Gas
- Manufacturing
- Aerospace and Defense
- Construction
- Automotive
- Power Generation
- Others
Non-Destructive Testing Market by Test Method
- Visual Testing
- Magnetic Particle Testing
- Liquid Penetrant Testing
- Eddy Current Testing
- Ultrasonic Testing
- Radiographic Testing
Non-Destructive Testing Market by Offering
- Non-destructive Equipment
- Non-destructive Testing Services
Non-Destructive Testing Market by Geography
- North America
- Europe
- Asia Pacific
- Rest of the World
The test ultrasonic testing method segment is anticipated to rise as the fastest-growing test method segment in the non-destructive testing market. This development is qualified for the growing implementation of ultrasonic detectors in manufacturing processes. These ultrasonic detectors are portable, easy to use, and exact results compared to traditional non-destructive testing techniques. The adoption of ultrasonic testing is refining rapidly and is anticipated to expand over the estimated period.
The high upfront cost of non-destructive equipment, joined with technical difficulties complicated in their deployment/installation, is the major reason influencing end-users to outsource their non-destructive testing operations. In addition, a lack of an expert workforce to perform non-destructive testing is another factor limiting new installations of non-destructive testing equipment internationally. Stringent government regulations regarding work safety are supplementary influencing end-users to outsource their non-destructive testing operations to third-party service providers.
Based on vertical non-destructive testing has been customarily used broadly in oil and gas applications. Test methods like ultrasonic and eddy current have been used to detect cracks in the pipes, both underground and elevated. But with growing awareness, non-destructive testing techniques are being deployed in various applications like defense, aerospace, and automotive manufacturing.
Furthermore, power generation using shale oil in the U.S. and Canada is anticipated to impact the development rate in the region positively. Besides, the rising emphasis on non-destructive testing to avoid unanticipated failures of systems is anticipated to drive the regional market.
This report gives the profiles of companies leading the Non-Destructive Testing market: General Electric, Nikon Metrology NV, Olympus Corp, Mistras Group, Yxlon International GmbH; Sonatest Ltd, Eddyfi Technologies; Zetec Inc. Fischer Technologies Inc.; and Ashtead Technology Ltd.
- This report offers an overall analysis of the Non-Destructive Testing market growth drivers, restraints.
- This report represents the market developments, such as new product launches, mergers and acquisitions, diversification, and joint ventures of the market players.
- This report also describes all potential segments and sub-segments present in the market to help the companies in strategic business planning.
- This report also gives the regional analysis of the Non-Destructive Testing market in terms of market penetration across the world.
- Executive Summary
- Industry Outlook
- Industry Overview
- Industry Trends
- Market Snapshot
- Market Definition
- Market Outlook
- Porter Five Forces
- Related Markets
- Market characteristics
- Market Overview
- Market Segmentation
- Market Dynamics
- Drivers
- Restraints
- Opportunities
- DRO - Impact Analysis
- Offering: Market Size & Analysis
- Overview
- Non-destructive Testing Services
- Non-destructive Testing Equipment
- Testing Method: Market Size & Analysis
- Overview
- Visual Testing
- Magnetic Particle Testing
- Liquid Penetrant Testing
- Eddy Current Testing
- Ultrasonic Testing
- Radiographic Testing
- Vertical: Market Size & Analysis
- Overview
- Oil & Gas
- Manufacturing
- Aerospace and Defense
- Construction
- Automotive
- Power Generation
- Others
- Geography: Market Size & Analysis
- Overview
- North America
- Europe
- Asia Pacific
- Rest of the World
- Competitive Landscape
- Competitor Comparison Analysis
- Market Developments
- Mergers and Acquisitions, Legal, Awards, Partnerships
- Product Launches and execution
- Vendor Profiles
- General Electric
- Overview
- Financial Overview
- Product Offerings
- Developments
- Business Strategy
- Bosello High Technology SRL
- Overview
- Financial Overview
- Product Offerings
- Developments
- Business Strategy
- Olympus Corporation
- Overview
- Financial Overview
- Product Offerings
- Developments
- Business Strategy
- Cygnus Instruments Ltd.
- Overview
- Financial Overview
- Product Offerings
- Developments
- Business Strategy
- T.D. Williamson Inc.
- Overview
- Financial Overview
- Product Offerings
- Developments
- Business Strategy
- Fischer Technology Inc.
- Overview
- Financial Overview
- Product Offerings
- Developments
- Business Strategy
- YXLON International
- Overview
- Financial Overview
- Product Offerings
- Developments
- Business Strategy
- Sonatest
- Overview
- Financial Overview
- Product Offerings
- Developments
- Business Strategy
- MISTRAS Group
- Overview
- Financial Overview
- Product Offerings
- Developments
- Business Strategy
- Nikon Metrology
- Overview
- Financial Overview
- Product Offerings
- Developments
- Business Strategy
- General Electric
- Companies to Watch
- Ashtead Technology
- Overview
- Products & Services
- Business Strategy
- Zetec, Inc.
- Overview
- Products & Services
- Business Strategy
- Eddyfi
- Overview
- Products & Services
- Business Strategy
- Magnaflux
- Overview
- Products & Services
- Business Strategy
- Ashtead Technology
- Analyst Opinion
- Annexure
- Report Scope
- Market Definitions
- Research Methodology
- Data Collation and In-house Estimation
- Market Triangulation
- Forecasting
- Report Assumptions
- Declarations
- Stakeholders
- Abbreviations
TABLE 1. GLOBAL NON-DESTRUCTIVE TESTING MARKET VALUE, BY OFFERING, 2020-2026 (USD BILLION)
TABLE 2. GLOBAL NON-DESTRUCTIVE TESTING MARKET VALUE FOR NON-DESTRUCTIVE TESTING SERVICES, BY GEOGRAPHY, 2020-2026 (USD BILLION)
TABLE 3. GLOBAL NON-DESTRUCTIVE TESTING MARKET VALUE FOR NON-DESTRUCTIVE TESTING EQUIPMENT, BY GEOGRAPHY, 2020-2026 (USD BILLION)
TABLE 4. GLOBAL NON-DESTRUCTIVE TESTING MARKET VALUE, BY TESTING METHOD, 2020-2026 (USD BILLION)
TABLE 5. GLOBAL NON-DESTRUCTIVE TESTING MARKET VALUE FOR VISUAL TESTING, BY GEOGRAPHY, 2020-2026 (USD BILLION)
TABLE 6. GLOBAL NON-DESTRUCTIVE TESTING MARKET VALUE FOR MAGNETIC PARTICLE TESTING, BY GEOGRAPHY, 2020-2026 (USD BILLION)
TABLE 7. GLOBAL NON-DESTRUCTIVE TESTING MARKET VALUE FOR LIQUID PENETRANT TESTING, BY GEOGRAPHY, 2020-2026 (USD BILLION)
TABLE 8. GLOBAL NON-DESTRUCTIVE TESTING MARKET VALUE FOR EDDY CURRENT TESTING, BY GEOGRAPHY, 2020-2026 (USD BILLION)
TABLE 9. GLOBAL NON-DESTRUCTIVE TESTING MARKET VALUE FOR ULTRASONIC TESTING, BY GEOGRAPHY, 2020-2026 (USD BILLION)
TABLE 10. GLOBAL NON-DESTRUCTIVE TESTING MARKET VALUE FOR RADIOGRAPHIC TESTING, BY GEOGRAPHY, 2020-2026 (USD BILLION)
TABLE 11. GLOBAL NON-DESTRUCTIVE TESTING MARKET VALUE, BY VERTICAL, 2020-2026 (USD BILLION)
TABLE 12. GLOBAL NON-DESTRUCTIVE TESTING MARKET VALUE FOR OIL & GAS, 2020-2026 (USD BILLION)
TABLE 13. GLOBAL NON-DESTRUCTIVE TESTING MARKET VALUE FOR MANUFACTURING, BY GEOGRAPHY, 2020-2026 (USD BILLION)
TABLE 14. GLOBAL NON-DESTRUCTIVE TESTING MARKET VALUE FOR AEROSPACE AND DEFENSE, BY GEOGRAPHY, 2020-2026 (USD BILLION)
TABLE 15. GLOBAL NON-DESTRUCTIVE TESTING MARKET VALUE FOR CONSTRUCTION, BY GEOGRAPHY, 2020-2026 (USD BILLION)
TABLE 16. GLOBAL NON-DESTRUCTIVE TESTING MARKET VALUE FOR AUTOMOTIVE, BY GEOGRAPHY, 2020-2026 (USD BILLION)
TABLE 17. GLOBAL NON-DESTRUCTIVE TESTING MARKET VALUE FOR POWER GENERATION, BY GEOGRAPHY, 2020-2026 (USD BILLION)
TABLE 18. GLOBAL NON-DESTRUCTIVE TESTING MARKET VALUE FOR OTHERS, BY GEOGRAPHY, 2020-2026 (USD BILLION)
TABLE 19. NORTH AMERICA NON-DESTRUCTIVE TESTING MARKET VALUE, BY COUNTRY, 2020-2026 (USD BILLION)
TABLE 20. NORTH AMERICA NON-DESTRUCTIVE TESTING MARKET VALUE, BY OFFERING, 2020-2026 (USD BILLION)
TABLE 21. NORTH AMERICA NON-DESTRUCTIVE TESTING MARKET VALUE, BY TESTING METHOD, 2020-2026 (USD BILLION)
TABLE 22. NORTH AMERICA NON-DESTRUCTIVE TESTING MARKET VALUE, BY VERTICAL, 2020-2026 (USD BILLION)
TABLE 23. U.S NON-DESTRUCTIVE TESTING MARKET VALUE, BY OFFERING, 2020-2026 (USD BILLION)
TABLE 24. U.S NON-DESTRUCTIVE TESTING MARKET VALUE, BY TESTING METHOD, 2020-2026 (USD BILLION)
TABLE 25. U.S NON-DESTRUCTIVE TESTING MARKET VALUE, BY VERTICAL, 2020-2026 (USD BILLION)
TABLE 26. CANADA NON-DESTRUCTIVE TESTING MARKET VALUE, BY OFFERING, 2020-2026 (USD BILLION)
TABLE 27. CANADA NON-DESTRUCTIVE TESTING MARKET VALUE, BY TESTING METHOD, 2020-2026 (USD BILLION)
TABLE 28. CANADA NON-DESTRUCTIVE TESTING MARKET VALUE, BY VERTICAL, 2020-2026 (USD BILLION)
TABLE 29. EUROPE NON-DESTRUCTIVE TESTING MARKET VALUE, BY COUNTRY, 2020-2026 (USD BILLION)
TABLE 30. EUROPE NON-DESTRUCTIVE TESTING MARKET VALUE, BY OFFERING, 2020-2026 (USD BILLION)
TABLE 31. EUROPE NON-DESTRUCTIVE TESTING MARKET VALUE, BY TESTING METHOD, 2020-2026 (USD BILLION)
TABLE 32. EUROPE NON-DESTRUCTIVE TESTING MARKET VALUE, VERTICAL, 2020-2026 (USD BILLION)
TABLE 33. GERMANY NON-DESTRUCTIVE TESTING MARKET VALUE, BY OFFERING, 2020-2026 (USD BILLION)
TABLE 34. GERMANY NON-DESTRUCTIVE TESTING MARKET VALUE, BY TESTING METHOD, 2020-2026 (USD BILLION)
TABLE 35. GERMANY NON-DESTRUCTIVE TESTING MARKET VALUE, BY VERTICAL, 2020-2026 (USD BILLION)
TABLE 36. U.K NON-DESTRUCTIVE TESTING MARKET VALUE, BY OFFERING, 2020-2026 (USD BILLION)
TABLE 37. U.K NON-DESTRUCTIVE TESTING MARKET VALUE, BY TESTING METHOD, 2020-2026 (USD BILLION)
TABLE 38. U.K NON-DESTRUCTIVE TESTING MARKET VALUE, BY VERTICAL, 2020-2026 (USD BILLION)
TABLE 39. FRANCE NON-DESTRUCTIVE TESTING MARKET VALUE, BY OFFERING, 2020-2026 (USD BILLION)
TABLE 40. FRANCE NON-DESTRUCTIVE TESTING MARKET VALUE, BY TESTING METHOD, 2020-2026 (USD BILLION)
TABLE 41. FRANCE NON-DESTRUCTIVE TESTING MARKET VALUE, BY VERTICAL, 2020-2026 (USD BILLION)
TABLE 42. ITALY NON-DESTRUCTIVE TESTING MARKET VALUE, BY OFFERING, 2020-2026 (USD BILLION)
TABLE 43. ITALY NON-DESTRUCTIVE TESTING MARKET VALUE, BY TESTING METHOD, 2020-2026 (USD BILLION)
TABLE 44. ITALY NON-DESTRUCTIVE TESTING MARKET VALUE, BY VERTICAL, 2020-2026 (USD BILLION)
TABLE 45. SPAIN NON-DESTRUCTIVE TESTING MARKET VALUE, BY OFFERING, 2020-2026 (USD BILLION)
TABLE 46. SPAIN NON-DESTRUCTIVE TESTING MARKET VALUE, BY TESTING METHOD, 2020-2026 (USD BILLION)
TABLE 47. SPAIN NON-DESTRUCTIVE TESTING MARKET VALUE, BY VERTICAL, 2020-2026 (USD BILLION)
TABLE 48. ROE NON-DESTRUCTIVE TESTING MARKET VALUE, BY OFFERING, 2020-2026 (USD BILLION)
TABLE 49. ROE NON-DESTRUCTIVE TESTING MARKET VALUE, BY TESTING METHOD, 2020-2026 (USD BILLION)
TABLE 50. ROE NON-DESTRUCTIVE TESTING MARKET VALUE, BY VERTICAL, 2020-2026 (USD BILLION)
TABLE 51. ASIA PACIFIC NON-DESTRUCTIVE TESTING MARKET VALUE, BY COUNTRY, 2020-2026 (USD BILLION)
TABLE 52. ASIA PACIFIC NON-DESTRUCTIVE TESTING MARKET VALUE, BY OFFERING, 2020-2026 (USD BILLION)
TABLE 53. ASIA PACIFIC NON-DESTRUCTIVE TESTING MARKET VALUE, BY TESTING METHOD, 2020-2026 (USD BILLION)
TABLE 54. ASIA PACIFIC NON-DESTRUCTIVE TESTING MARKET VALUE, BY VERTICAL, 2020-2026 (USD BILLION)
TABLE 55. CHINA NON-DESTRUCTIVE TESTING MARKET VALUE, BY OFFERING, 2020-2026 (USD BILLION)
TABLE 56. CHINA NON-DESTRUCTIVE TESTING MARKET VALUE, BY TESTING METHOD, 2020-2026 (USD BILLION)
TABLE 57. CHINA NON-DESTRUCTIVE TESTING MARKET VALUE, BY VERTICAL, 2020-2026 (USD BILLION)
TABLE 58. INDIA NON-DESTRUCTIVE TESTING MARKET VALUE, BY OFFERING, 2020-2026 (USD BILLION)
TABLE 59. INDIA NON-DESTRUCTIVE TESTING MARKET VALUE, BY TESTING METHOD, 2020-2026 (USD BILLION)
TABLE 60. INDIA NON-DESTRUCTIVE TESTING MARKET VALUE, BY VERTICAL, 2020-2026 (USD BILLION)
TABLE 61. JAPAN NON-DESTRUCTIVE TESTING MARKET VALUE, BY OFFERING, 2020-2026 (USD BILLION)
TABLE 62. JAPAN NON-DESTRUCTIVE TESTING MARKET VALUE, BY TESTING METHOD, 2020-2026 (USD BILLION)
TABLE 63. JAPAN NON-DESTRUCTIVE TESTING MARKET VALUE, BY VERTICAL, 2020-2026 (USD BILLION)
TABLE 64. REST OF APAC NON-DESTRUCTIVE TESTING MARKET VALUE, BY OFFERING, 2020-2026 (USD BILLION)
TABLE 65. REST OF APAC NON-DESTRUCTIVE TESTING MARKET VALUE, BY TESTING METHOD, 2020-2026 (USD BILLION)
TABLE 66. REST OF APAC NON-DESTRUCTIVE TESTING MARKET VALUE, BY VERTICAL, 2020-2026 (USD BILLION)
TABLE 67. REST OF WORLD NON-DESTRUCTIVE TESTING MARKET VALUE, BY OFFERING, 2020-2026 (USD BILLION)
TABLE 68. REST OF WORLD NON-DESTRUCTIVE TESTING MARKET VALUE, BY TESTING METHOD, 2020-2026 (USD BILLION)
TABLE 69. REST OF WORLD NON-DESTRUCTIVE TESTING MARKET VALUE, BY VERTICAL, 2020-2026 (USD BILLION)
TABLE 70. GENERAL ELECTRIC: FINANCIALS
TABLE 71. GENERAL ELECTRIC: PRODUCTS & SERVICES
TABLE 72. GENERAL ELECTRIC: RECENT DEVELOPMENTS
TABLE 73. BOSELLO HIGH TECHNOLOGY SRL: FINANCIALS
TABLE 74. BOSELLO HIGH TECHNOLOGY SRL: PRODUCTS & SERVICES
TABLE 75. BOSELLO HIGH TECHNOLOGY SRL: RECENT DEVELOPMENTS
TABLE 76. OLYMPUS CORPORATION: FINANCIALS
TABLE 77. OLYMPUS CORPORATION: PRODUCTS & SERVICES
TABLE 78. OLYMPUS CORPORATION: RECENT DEVELOPMENTS
TABLE 79. CYGNUS INSTRUMENTS LTD: FINANCIALS
TABLE 80. CYGNUS INSTRUMENTS LTD: PRODUCTS & SERVICES
TABLE 81. CYGNUS INSTRUMENTS LTD: RECENT DEVELOPMENTS
TABLE 82. T.D. WILLIAMSON INC: FINANCIALS
TABLE 83. T.D. WILLIAMSON INC: PRODUCTS & SERVICES
TABLE 84. T.D. WILLIAMSON INC: RECENT DEVELOPMENTS
TABLE 85. FISCHER TECHNOLOGY INC: FINANCIALS
TABLE 86. FISCHER TECHNOLOGY INC: PRODUCTS & SERVICES
TABLE 87. FISCHER TECHNOLOGY INC: RECENT DEVELOPMENTS
TABLE 88. YXLON INTERNATIONAL: FINANCIALS
TABLE 89. YXLON INTERNATIONAL: PRODUCTS & SERVICES
TABLE 90. YXLON INTERNATIONAL: RECENT DEVELOPMENTS
TABLE 91. SONATEST: FINANCIALS
TABLE 92. SONATEST: PRODUCTS & SERVICES
TABLE 93. SONATEST: RECENT DEVELOPMENTS
TABLE 94. MISTRAS GROUP: FINANCIALS
TABLE 95. MISTRAS GROUP: PRODUCTS & SERVICES
TABLE 96. MISTRAS GROUP: RECENT DEVELOPMENTS
TABLE 97. NIKON METROLOGY: FINANCIALS
TABLE 98. NIKON METROLOGY: PRODUCTS & SERVICES
TABLE 99. NIKON METROLOGY: RECENT DEVELOPMENTS
TABLE 100. ASHTEAD TECHNOLOGY: PRODUCTS & SERVICES
TABLE 101. ZETEC, INC: PRODUCTS & SERVICES
TABLE 102. EDDYFI: PRODUCTS & SERVICES
TABLE 103. MAGNAFLUX: PRODUCTS & SERVICES
Research Framework
Infoholic Research works on a holistic 360° approach in order to deliver high quality, validated and reliable information in our market reports. The Market estimation and forecasting involves following steps:
- Data Collation (Primary & Secondary)
- In-house Estimation (Based on proprietary data bases and Models)
- Market Triangulation
- Forecasting

Market related information is congregated from both primary and secondary sources.
Primary sources
Involved participants from all global stakeholders such as Solution providers, service providers, Industry associations, thought leaders etc. across levels such as CXOs, VPs and managers. Plus, our in-house industry experts having decades of industry experience contribute their consulting and advisory services.
Secondary sources
Include public sources such as regulatory frameworks, government IT spending, government demographic indicators, industry association statistics, and company publications along with paid sources such as Factiva, OneSource, Bloomberg among others.
![]()

