
Home Infusion Therapy Market by Product (Infusion Pump, IV Cannulas, Intravenous Sets, Needleless Connectors, and Compression Therapy) Application (Anti-Infective, Endocrinology, Hydration Therapy, Chemotherapy, Other Ligament Injuries, Enteral Nutrition, Specialty Pharmaceuticals, and Compression Therapy) Geography (North America, Europe, Asia Pacific and Rest of the World)
- August, 2020
- Domain: ICT - Verticals - Healthcare
- Get Free 10% Customization in this Report
Home infusion therapy is a process to provide treatment for the patients at home through intravenous or subcutaneous infusion of drugs or biological. Home infusion therapy enables users to treat patients through catheters and needles in the comfort of the patient's home. Home infusion therapy allows the patients to avoid long and unnecessary stays in the hospitals and reduces hospital costs. The key factors propelling the market growth are an increase in the elderly population, where the patient is not able to walk to the healthcare center, and advancements in the healthcare technology in infusion therapy made easy to use without any errors in the dosage of the fluids. However, the lack of knowledge about infusion therapy at home is a restrain for the home infusion therapy market growth. The present situation of the COVID-19 Pandemic has a major impact on the home infusion therapy market, where the patients are restricted from going to the healthcare centers for unnecessary treatments. Home infusion therapy is the best service for this situation. The home infusion therapy market is estimated to reach USD 30.4 billion by 2025 from an estimated value of USD 18.11 billion in 2020, growing at a CAGR of 8.9% during the forecast period.
The Home infusion therapy market scope includes
Based on Product:
- Infusion Pumps
- Intravenous Sets
- IV Cannulas
- Needleless Connectors
Based on Application:
- Anti-Infectives
- Endocrinology
- Enteral nutrition
- Hydration Therapy
- Parenteral Nutrition
- Specialty Pharmceuticals
- Others
Based on Geography:
- North America
- Europe
- Asia Pacific
- Rest of the World
The home infusion therapy market, based on the product, the infusion pumps are projected to have the largest share in the market. The infusion pumps are further divided into ambulatory infusion pumps and further categorized into insulin pumps, syringe pumps, and elastomeric pump. Infusion pumps are used to deliver the nutrients and fluids into the body at automated intervals and tiny volumes.
Further, based on the application the anti-infective segment has held the largest share in the market growth. The increase in delivering medication such as anti-fungal and antibiotics and cost-effective treatment without approaching hospitals are the factors which boost the market growth.
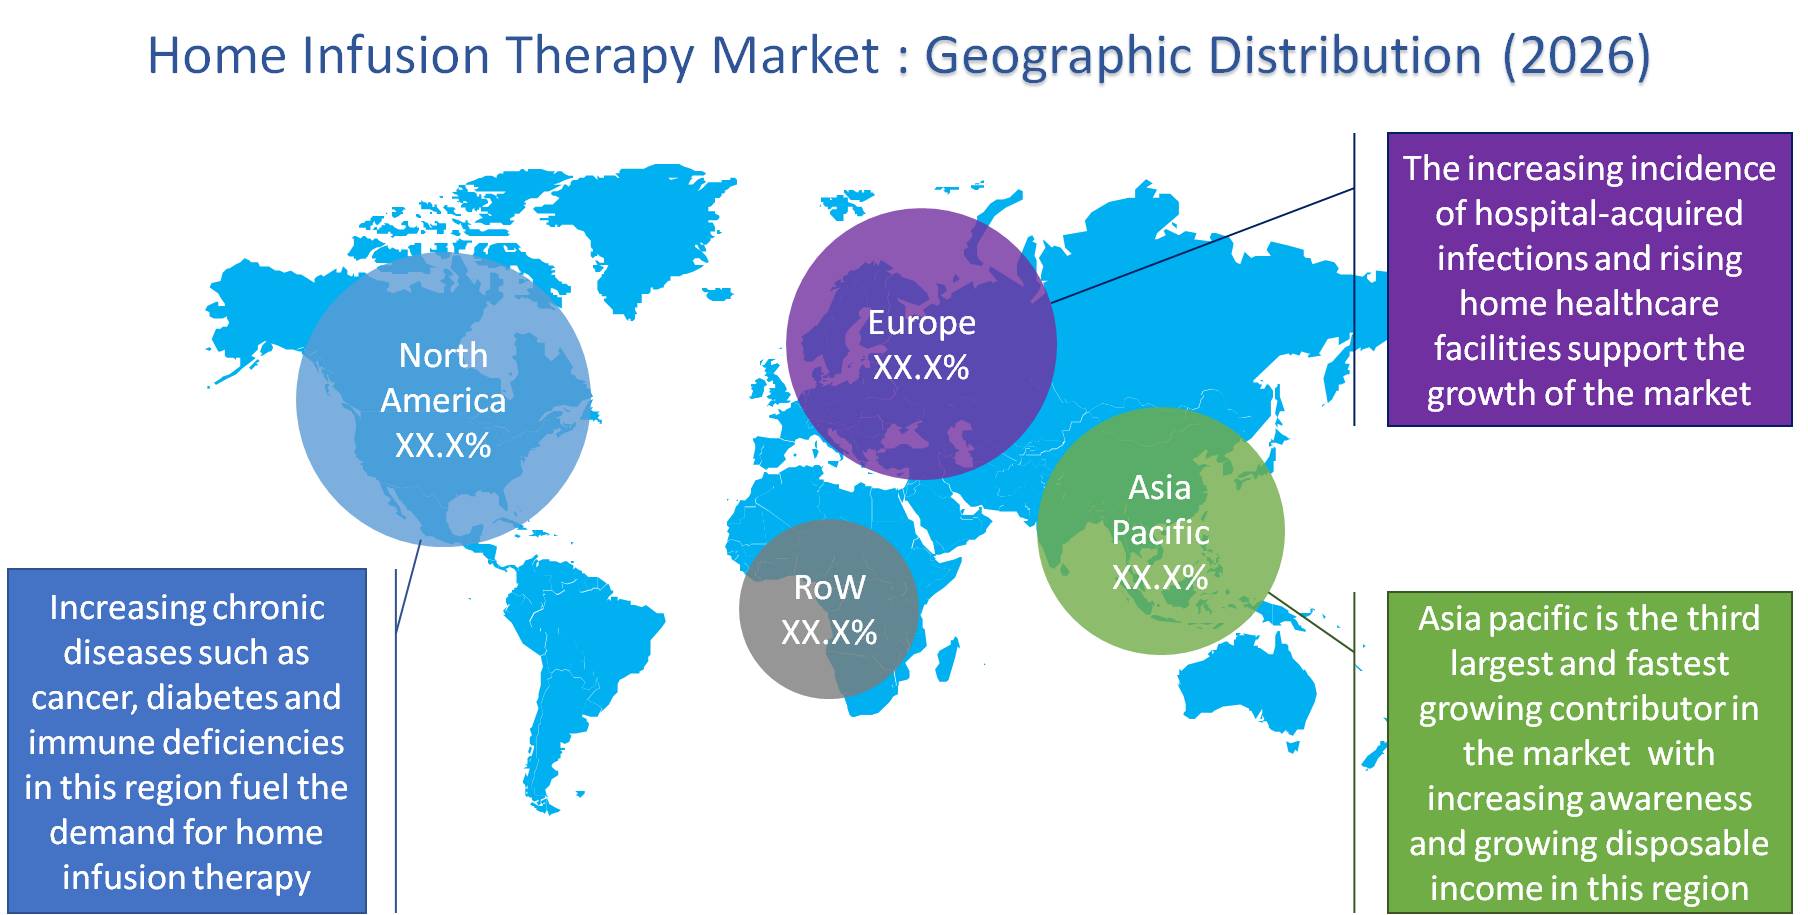
Moreover, the increasing elderly population, changing lifestyle, which is unhealthy, leads to chronic diseases such as diabetes and immune deficiencies in North America is increasing the demand for home infusion therapy. The Asia Pacific is also predicted to be the rapidly growing market due to the rising awareness about home infusion advantages and increasing disposable income in this region.
Globally, Home infusion therapy is increasingly adopted by the patients for the comfortable homecare setting and to avoid the expenses in the healthcare centers. The major factors fostering market growth are innovative products such as wireless infusion pumps with remote programmability, where a healthcare professional can closely monitor the patients. In addition, the growing elderly population is the major factor which is driving the market growth. Somehow, the overdose of the fluids can cause a risk to health, which is hampering the market growth.
This report also includes the analysis of key players of the Home Infusion Therapy Market - Braun Melsungen AG, CareFusion Corporation, ICU Medical Inc., Baxter Inc, Smith’s Medical, Caesarea Medical Electronics, Terumo Corporation, JMS co. Ltd, Hospira Inc, and Abbott Laboratories
Moreover, home infusion therapy products and services are acquired by the emerging countries due to the reduced costs and the changing lifestyle of the people. The increasing awareness about the benefits of home infusion therapy at home is supporting market growth. This report of the home infusion therapy market will assist the market competitors in understanding the major market trends, market dynamics, and dynamic requirements of the end-users. The analysis based on the quantitative and qualitative intensifies the user experience of the report.
- The home infusion therapy market report gives the market analysis of the current shifts, opportunities and hindering factors in the market.
- This research also helps in understanding the overall analysis of key vendors based on product innovation, recent development, acquisition and mergers.
- This report also assists vendors of home infusion therapy for the improvement of the products based on the end-user requirement.
- Executive Summary
- Executive Summary
- Market Positioning
- Industry Snapshot
- Industry Overview
- Key Trends
- Industry Snapshot
- Market Outlook
- Introduction
- Market Segmentation
- Market Characteristics
- PESTLE Analysis
- Porter’s Five Force Analysis
- Market Dynamics
- Drivers
- Rising demand for ambulatory infusion therapy
- Increasing incidence of chronic diseases
- Restraints
- Stringent regulatory requirements for new products
- Opportunities
- Growing adoption of specialty infusion systems
- COVID-19 Impact
- DRO Impact Analysis
- Drivers
- Home Infusion Therapy Market, By Product
- Overview
- Infusion Pump
- Intravenous Sets
- IV Cannulas
- Needleless Connectors
- Home Infusion Therapy Market, By Application
- Overview
- Anti-Infectives
- Endocrinology
- Enteral nutrition
- Hydration Therapy
- Parenteral Nutrition
- Specialty Pharmaceuticals
- Others
- Home Infusion Therapy Market, By Geography
- Overview
- Asia Pacific
- Asia Pacific Home Infusion Therapy Market, By Country
- China Home Infusion Therapy Market
- India Home Infusion Therapy Market
- Japan Home Infusion Therapy Market
- Australia Home Infusion Therapy Market
- South Korea Home Infusion Therapy Market
- Rest of APAC Home Infusion Therapy Market
- Asia Pacific Home Infusion Therapy Market, By Product
- Asia Pacific Home Infusion Therapy Market, By Application
- Asia Pacific Home Infusion Therapy Market, By Country
- North America
- North America Home Infusion Therapy Market, By Country
- The U.S. Home Infusion Therapy Market
- Canada Home Infusion Therapy Market
- North America Home Infusion Therapy Market, By Product
- North America Home Infusion Therapy Market, By Application
- North America Home Infusion Therapy Market, By Country
- Europe
- Europe Home Infusion Therapy Market, By Country
- Germany Home Infusion Therapy Market
- The U.K. Home Infusion Therapy Market
- France Home Infusion Therapy Market
- Italy Home Infusion Therapy Market
- Spain Home Infusion Therapy Market
- Russia Home Infusion Therapy Market
- Rest of Europe Home Infusion Therapy Market
- Europe Home Infusion Therapy Market, By Product
- Europe Home Infusion Therapy Market, By Application
- Europe Home Infusion Therapy Market, By Country
- Rest of the World
- Rest of the World Home Infusion Therapy Market, By Region
- Rest of the World Home Infusion Therapy Market, By Product
- Rest of the World Home Infusion Therapy Market, By Application
- Competitive Landscape
- Growth Strategies Analysis
- Market Developments
- Mergers & Acquisitions (M&A)
- Expansions
- Business Restructuring
- Product Launches & Exhibitions
- Vendor Profiles
- B. Braun Melsungen AG
- Overview
- Product Profile
- Recent developments
- SWOT analysis
- Business strategies
- Baxter International Inc.
- Overview
- Product Profile
- Recent developments
- SWOT analysis
- Business strategies
- ICU Medical, Inc.
- Overview
- Product Profile
- Recent developments
- SWOT analysis
- Business strategies
- JMS Co., Ltd.
- Overview
- Product Profile
- Business strategies
- Smith’s Medical
- Overview
- Product Profile
- Recent developments
- SWOT analysis
- Business strategies
- Terumo Corporation
- Overview
- Product Profile
- Recent developments
- SWOT analysis
- Business strategies
- Becton, Dickinson and Company
- Overview
- Product Profile
- Recent developments
- SWOT analysis
- Business strategies
- Abbott Laboratories
- Overview
- Product Profile
- SWOT analysis
- Business strategies
- Fresenius Kabi AG
- Overview
- Product Profile
- SWOT analysis
- Business strategies
- B. Braun Melsungen AG
- Annexure
- Report Scope
- Market Definition
- Research Methodology
- Data Collation & In-house Estimation
- Market Triangulation
- Forecasting
- Study Declarations
- Report Assumptions
- Stakeholders
- Abbreviations
TABLE 1. GLOBAL HOME INFUSION THERAPY MARKET VALUE, BY PRODUCT, 2020-2026 (USD MILLION)
TABLE 2. GLOBAL HOME INFUSION THERAPY MARKET VALUE FOR INFUSION PUMPS, BY GEOGRAPHY, 2020-2026 (USD MILLION)
TABLE 3. GLOBAL HOME INFUSION THERAPY MARKET VALUE FOR INTRAVENOUS SETS, BY GEOGRAPHY, 2020-2026 (USD MILLION)
TABLE 4. GLOBAL HOME INFUSION THERAPY MARKET VALUE FOR IV CANNULAS, BY GEOGRAPHY, 2020-2026 (USD MILLION)
TABLE 5. GLOBAL HOME INFUSION THERAPY MARKET VALUE FOR NEEDLELESS CONNECTORS, BY GEOGRAPHY, 2020-2026 (USD MILLION)
TABLE 6. GLOBAL HOME INFUSION THERAPY MARKET VALUE FOR OTHERS, BY GEOGRAPHY, 2020-2026 (USD MILLION)
TABLE 7. GLOBAL HOME INFUSION THERAPY MARKET VALUE FOR APPLICATION, BY GEOGRAPHY, 2020-2026 (USD MILLION)
TABLE 8. GLOBAL HOME INFUSION THERAPY MARKET VALUE FOR ANTI-INFECTIVE, BY GEOGRAPHY, 2020-2026 (USD MILLION)
TABLE 9. GLOBAL HOME INFUSION THERAPY MARKET VALUE FOR ENDOCRINOLOGY, BY GEOGRAPHY, 2020-2026 (USD MILLION)
TABLE 10. GLOBAL HOME INFUSION THERAPY MARKET VALUE FOR ENTERAL NUTRITION, BY GEOGRAPHY, 2020-2026 (USD MILLION)
TABLE 11. GLOBAL HOME INFUSION THERAPY MARKET VALUE FOR HYDRATION THERAPY, BY GEOGRAPHY, 2020-2026 (USD MILLION)
TABLE 12. GLOBAL HOME INFUSION THERAPY MARKET VALUE FOR PARENTERAL NUTRITION, BY GEOGRAPHY, 2020-2026 (USD MILLION)
TABLE 13. GLOBAL HOME INFUSION THERAPY MARKET VALUE FOR SPECIALTY PHARMACEUTICALS, BY GEOGRAPHY, 2020-2026 (USD MILLION)
TABLE 14. GLOBAL HOME INFUSION THERAPY MARKET VALUE FOR OTHERS, BY GEOGRAPHY, 2020-2026 (USD MILLION)
TABLE 15. NORTH AMERICA HOME INFUSION THERAPY MARKET VALUE, BY COUNTRY, 2020-2026 (USD MILLION)
TABLE 16. NORTH AMERICA HOME INFUSION THERAPY MARKET VALUE, BY PRODUCT, 2020-2026 (USD MILLION)
TABLE 17. NORTH AMERICA HOME INFUSION THERAPY MARKET VALUE FOR APPLICATION, BY GEOGRAPHY, 2020-2026 (USD MILLION)
TABLE 18. U.S HOME INFUSION THERAPY MARKET VALUE, BY PRODUCT, 2020-2026 (USD MILLION)
TABLE 19. U.S HOME INFUSION THERAPY MARKET VALUE FOR APPLICATION, BY GEOGRAPHY, 2020-2026 (USD MILLION)
TABLE 20. CANADA HOME INFUSION THERAPY MARKET VALUE, BY PRODUCT, 2020-2026 (USD MILLION)
TABLE 21. CANADA HOME INFUSION THERAPY MARKET VALUE FOR APPLICATION, BY GEOGRAPHY, 2020-2026 (USD MILLION)
TABLE 22. EUROPE HOME INFUSION THERAPY MARKET VALUE, BY COUNTRY, 2020-2026 (USD MILLION)
TABLE 23. EUROPE HOME INFUSION THERAPY MARKET VALUE, BY PRODUCT, 2020-2026 (USD MILLION)
TABLE 24. EUROPE HOME INFUSION THERAPY MARKET VALUE FOR APPLICATION, BY GEOGRAPHY, 2020-2026 (USD MILLION)
TABLE 25. GERMANY HOME INFUSION THERAPY MARKET VALUE, BY PRODUCT, 2020-2026 (USD MILLION)
TABLE 26. GERMANY HOME INFUSION THERAPY MARKET VALUE FOR APPLICATION, BY GEOGRAPHY, 2020-2026 (USD MILLION)
TABLE 27. U.K HOME INFUSION THERAPY MARKET VALUE, BY PRODUCT, 2020-2026 (USD MILLION)
TABLE 28. U.K HOME INFUSION THERAPY MARKET VALUE FOR APPLICATION, BY GEOGRAPHY, 2020-2026 (USD MILLION)
TABLE 29. FRANCE HOME INFUSION THERAPY MARKET VALUE, BY PRODUCT, 2020-2026 (USD MILLION)
TABLE 30. FRANCE HOME INFUSION THERAPY MARKET VALUE FOR APPLICATION, BY GEOGRAPHY, 2020-2026 (USD MILLION)
TABLE 31. ITALY HOME INFUSION THERAPY MARKET VALUE, BY PRODUCT, 2020-2026 (USD MILLION)
TABLE 32. ITALY HOME INFUSION THERAPY MARKET VALUE FOR APPLICATION, BY GEOGRAPHY, 2020-2026 (USD MILLION)
TABLE 33. ROE HOME INFUSION THERAPY MARKET VALUE, BY PRODUCT, 2020-2026 (USD MILLION)
TABLE 34. ROE HOME INFUSION THERAPY MARKET VALUE FOR APPLICATION, BY GEOGRAPHY, 2020-2026 (USD MILLION)
TABLE 35. ASIA PACIFIC HOME INFUSION THERAPY MARKET VALUE, BY COUNTRY, 2020-2026 (USD MILLION)
TABLE 36. ASIA PACIFIC HOME INFUSION THERAPY MARKET VALUE, BY PRODUCT, 2020-2026 (USD MILLION)
TABLE 37. ASIA PACIFIC HOME INFUSION THERAPY MARKET VALUE FOR APPLICATION, BY GEOGRAPHY, 2020-2026 (USD MILLION)
TABLE 38. CHINA HOME INFUSION THERAPY MARKET VALUE, BY PRODUCT, 2020-2026 (USD MILLION)
TABLE 39. CHINA HOME INFUSION THERAPY MARKET VALUE FOR APPLICATION, BY GEOGRAPHY, 2020-2026 (USD MILLION)
TABLE 40. INDIA HOME INFUSION THERAPY MARKET VALUE, BY PRODUCT, 2020-2026 (USD MILLION)
TABLE 41. INDIA HOME INFUSION THERAPY MARKET VALUE FOR APPLICATION, BY GEOGRAPHY, 2020-2026 (USD MILLION)
TABLE 42. JAPAN HOME INFUSION THERAPY MARKET VALUE, BY PRODUCT, 2020-2026 (USD MILLION)
TABLE 43. JAPAN HOME INFUSION THERAPY MARKET VALUE FOR APPLICATION, BY GEOGRAPHY, 2020-2026 (USD MILLION)
TABLE 44. AUSTRALIA HOME INFUSION THERAPY MARKET VALUE, BY PRODUCT, 2020-2026 (USD MILLION)
TABLE 45. AUSTRALIA HOME INFUSION THERAPY MARKET VALUE FOR APPLICATION, BY GEOGRAPHY, 2020-2026 (USD MILLION)
TABLE 46. REST OF ASIA PACIFIC HOME INFUSION THERAPY MARKET VALUE, BY PRODUCT, 2020-2026 (USD MILLION)
TABLE 47. REST OF ASIA PACIFIC HOME INFUSION THERAPY MARKET VALUE FOR APPLICATION, BY GEOGRAPHY, 2020-2026 (USD MILLION)
TABLE 48. REST OF WORLD HOME INFUSION THERAPY MARKET VALUE, BY PRODUCT, 2020-2026 (USD MILLION)
TABLE 49. REST OF WORLD HOME INFUSION THERAPY MARKET VALUE FOR APPLICATION, BY GEOGRAPHY, 2020-2026 (USD MILLION)
TABLE 50. CAREFUSION CORPORATION.: OVERVIEW
TABLE 51. CAREFUSION CORPORATION.: STRATEGIC SNAPSHOT
TABLE 52. CAREFUSION CORPORATION.: BUSINESS OPPORTUNITIES AND OUTLOOK
TABLE 53. CAREFUSION CORPORATION.: PRODUCT/SERVICE PORTFOLIO
TABLE 54. BAXTER INC: OVERVIEW
TABLE 55. BAXTER INC: STRATEGIC SNAPSHOT
TABLE 56. BAXTER INC: BUSINESS OPPORTUNITIES AND OUTLOOK
TABLE 57. BAXTER INC: PRODUCT/SERVICE PORTFOLIO
TABLE 58. ICU MEDICAL INC.: OVERVIEW
TABLE 59. ICU MEDICAL INC.: STRATEGIC SNAPSHOT
TABLE 60. ICU MEDICAL INC.: BUSINESS OPPORTUNITIES AND OUTLOOK
TABLE 61. ICU MEDICAL INC.: PRODUCT/SERVICE PORTFOLIO
TABLE 62. CAESAREA MEDICAL ELECTRONICS..: OVERVIEW
TABLE 63. CAESAREA MEDICAL ELECTRONICS..: STRATEGIC SNAPSHOT
TABLE 64. CAESAREA MEDICAL ELECTRONICS..: BUSINESS OPPORTUNITIES AND OUTLOOK
TABLE 65. CAESAREA MEDICAL ELECTRONICS..: PRODUCT/SERVICE PORTFOLIO
TABLE 66. SMITH’S MEDICAL: OVERVIEW
TABLE 67. SMITH’S MEDICAL: STRATEGIC SNAPSHOT
TABLE 68. SMITH’S MEDICAL: BUSINESS OPPORTUNITIES AND OUTLOOK
TABLE 69. SMITH’S MEDICAL: PRODUCT/SERVICE PORTFOLIO
TABLE 70. TERUMO CORPORATION.: OVERVIEW
TABLE 71. TERUMO CORPORATION.: STRATEGIC SNAPSHOT
TABLE 72. TERUMO CORPORATION.: BUSINESS OPPORTUNITIES AND OUTLOOK
TABLE 73. TERUMO CORPORATION.: PRODUCT/SERVICE PORTFOLIO
TABLE 74. BRAUN MELSUNGEN AG: OVERVIEW
TABLE 75. BRAUN MELSUNGEN AG: STRATEGIC SNAPSHOT
TABLE 76. BRAUN MELSUNGEN AG: BUSINESS OPPORTUNITIES AND OUTLOOK
TABLE 77. BRAUN MELSUNGEN AG: PRODUCT/SERVICE PORTFOLIO
TABLE 78. JMS CO. LTD .: OVERVIEW
TABLE 79. JMS CO. LTD.: STRATEGIC SNAPSHOT
TABLE 80. JMS CO. LTD.: BUSINESS OPPORTUNITIES AND OUTLOOK
TABLE 81. JMS CO. LTD.: PRODUCT/SERVICE PORTFOLIO
TABLE 82. HOSPIRA INC: OVERVIEW
TABLE 83. HOSPIRA INC: STRATEGIC SNAPSHOT
TABLE 84. HOSPIRA INC: BUSINESS OPPORTUNITIES AND OUTLOOK
TABLE 85. HOSPIRA INC: PRODUCT/SERVICE PORTFOLIO
TABLE 86. ABBOTT LABORATORIES.: OVERVIEW
TABLE 87. ABBOTT LABORATORIES.: STRATEGIC SNAPSHOT
TABLE 88. ABBOTT LABORATORIES.: BUSINESS OPPORTUNITIES AND OUTLO
TABLE 89. ABBOTT LABORATORIES.: PRODUCT/SERVICE PORTFOLIO
Research Framework
Infoholic Research works on a holistic 360° approach in order to deliver high quality, validated and reliable information in our market reports. The Market estimation and forecasting involves following steps:
- Data Collation (Primary & Secondary)
- In-house Estimation (Based on proprietary data bases and Models)
- Market Triangulation
- Forecasting

Market related information is congregated from both primary and secondary sources.
Primary sources
Involved participants from all global stakeholders such as Solution providers, service providers, Industry associations, thought leaders etc. across levels such as CXOs, VPs and managers. Plus, our in-house industry experts having decades of industry experience contribute their consulting and advisory services.
Secondary sources
Include public sources such as regulatory frameworks, government IT spending, government demographic indicators, industry association statistics, and company publications along with paid sources such as Factiva, OneSource, Bloomberg among others.
![]()


